 5
5peptides
spectra
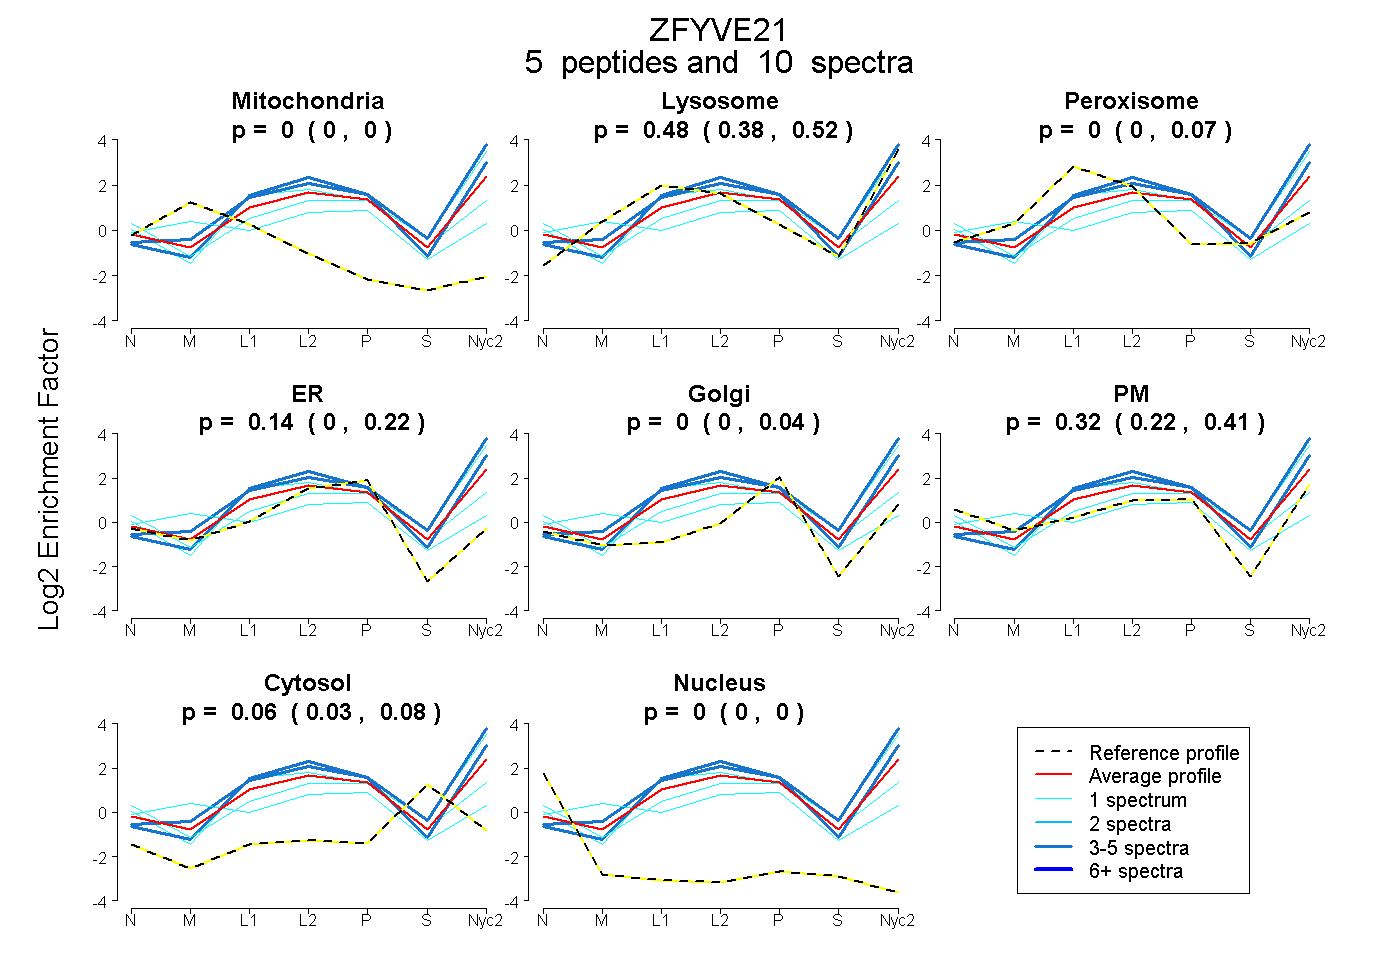
0.000 | 0.000
0.384 | 0.519
0.000 | 0.067
0.004 | 0.221
0.000 | 0.037
0.215 | 0.405
0.034 | 0.082
0.000 | 0.000
2peptides
spectra
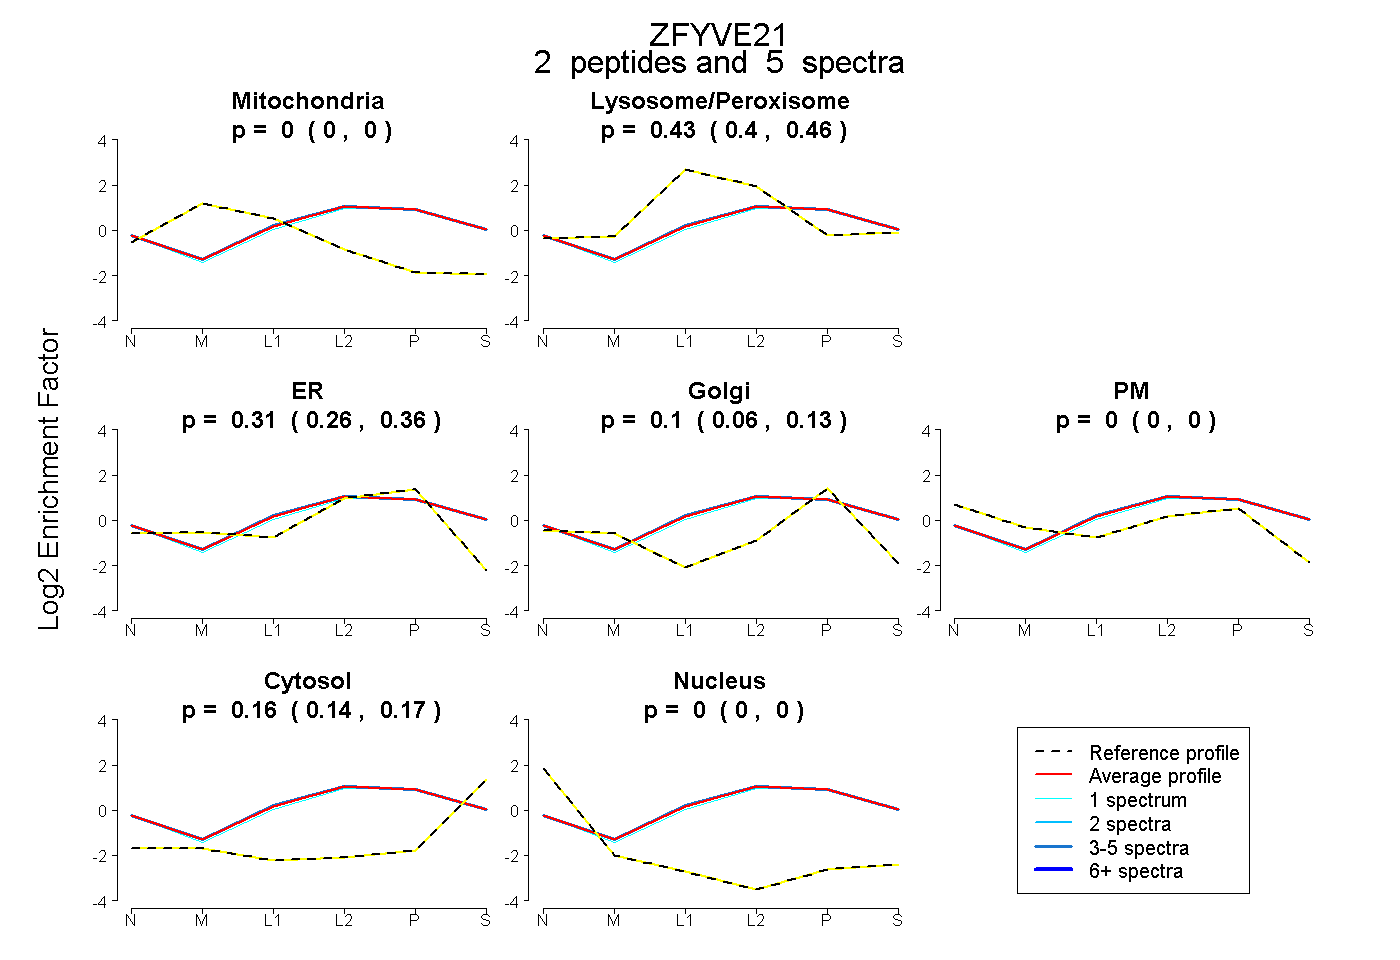
0.000 | 0.000
0.397 | 0.460
0.257 | 0.359
0.059 | 0.134
0.000 | 0.000
0.141 | 0.173
0.000 | 0.000
7peptides
spectra
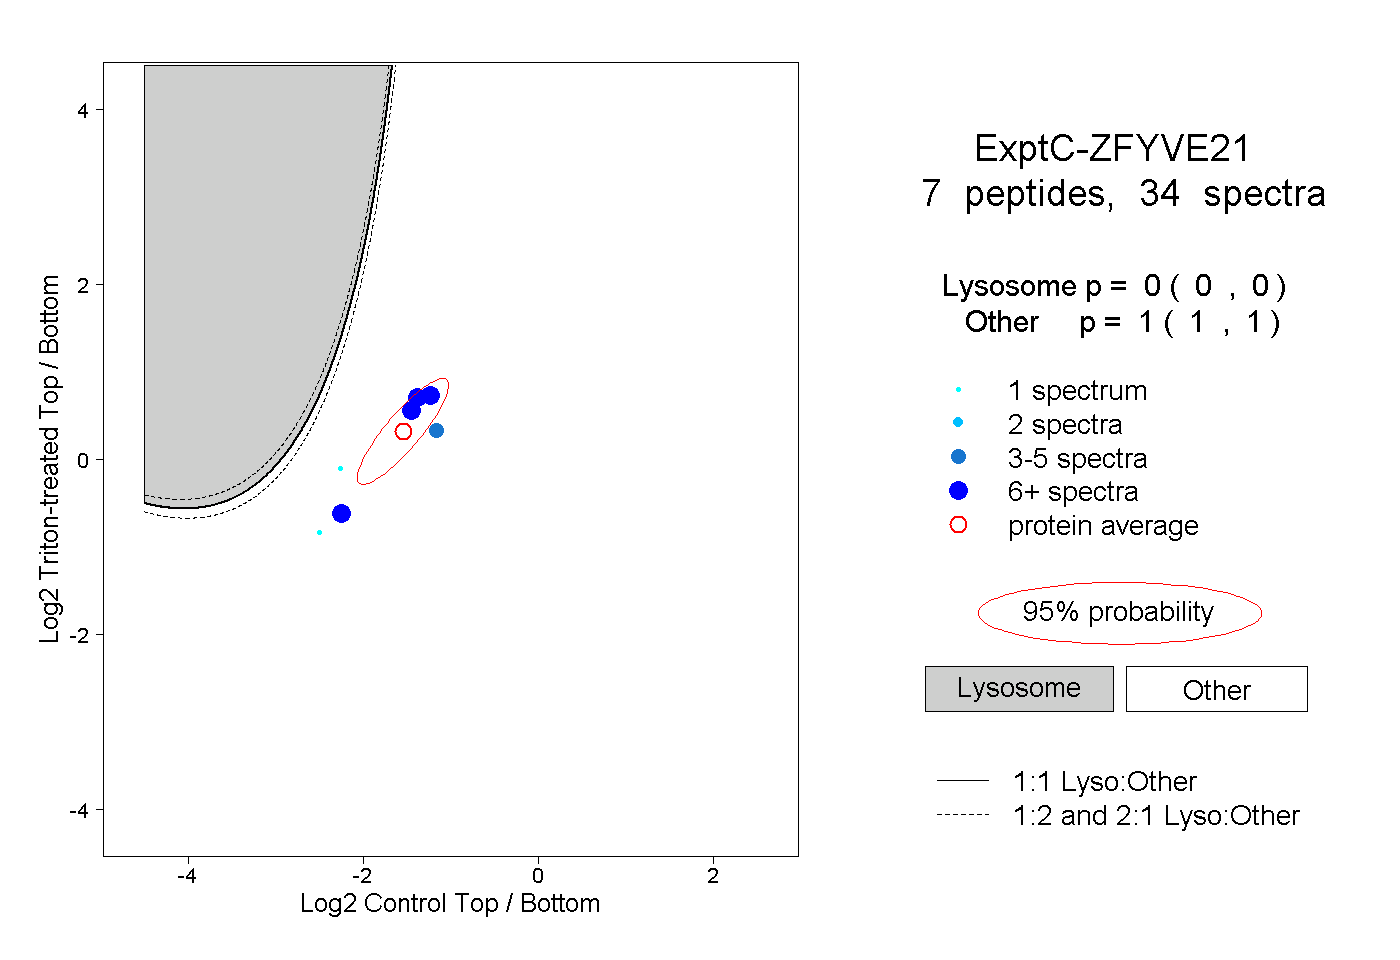
0.000 | 0.000
1.000 | 1.000
1peptide
spectrum
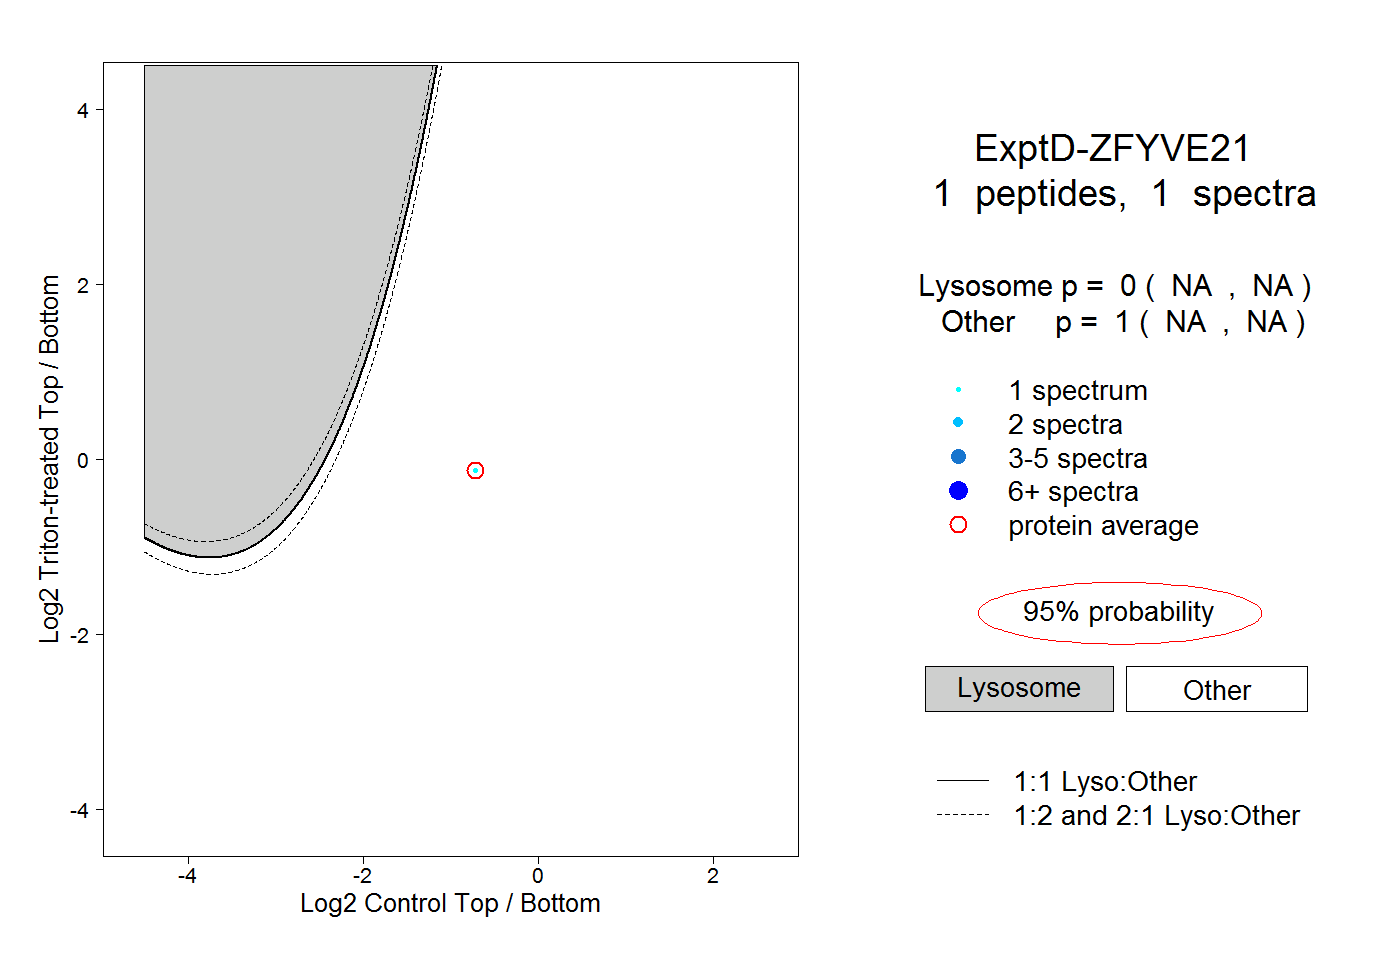
NA | NA
NA | NA