 5
5peptides
spectra
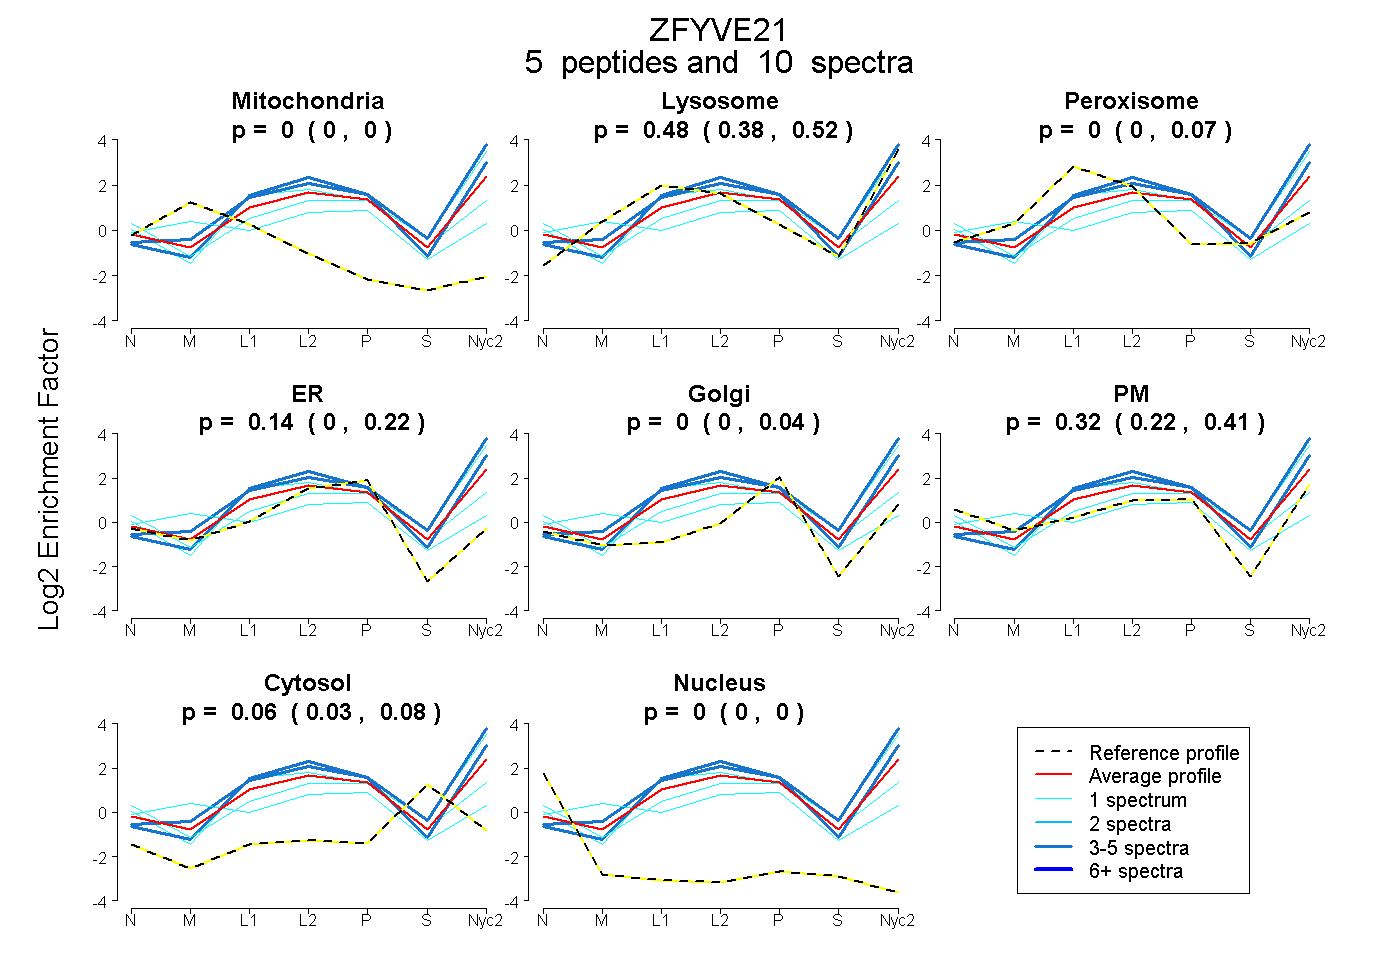
0.000 | 0.000
0.384 | 0.519
0.000 | 0.067
0.004 | 0.221
0.000 | 0.037
0.215 | 0.405
0.034 | 0.082
0.000 | 0.000
| Plot | Mito | Lyso | Perox | ER | Golgi | PM | Cytosol | Nucleus | |||||
| Expt A |
5 peptides |
10 spectra |
|
0.000 0.000 | 0.000 |
0.478 0.384 | 0.519 |
0.000 0.000 | 0.067 |
0.141 0.004 | 0.221 |
0.000 0.000 | 0.037 |
0.318 0.215 | 0.405 |
0.063 0.034 | 0.082 |
0.000 0.000 | 0.000 |
| 1 spectrum, QCADCALVSHR | 0.119 | 0.000 | 0.252 | 0.114 | 0.326 | 0.151 | 0.038 | 0.000 | ||
| 3 spectra, QAAAWLAAMHK | 0.000 | 0.654 | 0.000 | 0.161 | 0.000 | 0.185 | 0.000 | 0.000 | ||
| 1 spectrum, MVPEHR | 0.000 | 0.107 | 0.102 | 0.164 | 0.000 | 0.480 | 0.148 | 0.000 | ||
| 1 spectrum, EAEFYDK | 0.000 | 0.627 | 0.000 | 0.000 | 0.000 | 0.328 | 0.045 | 0.000 | ||
| 4 spectra, FDFITR | 0.000 | 0.807 | 0.000 | 0.016 | 0.058 | 0.120 | 0.000 | 0.000 |
| Plot | Mito | Lyso or Perox | ER | Golgi | PM | Cytosol | Nucleus | ||||||
| Expt B |
2 peptides |
5 spectra |
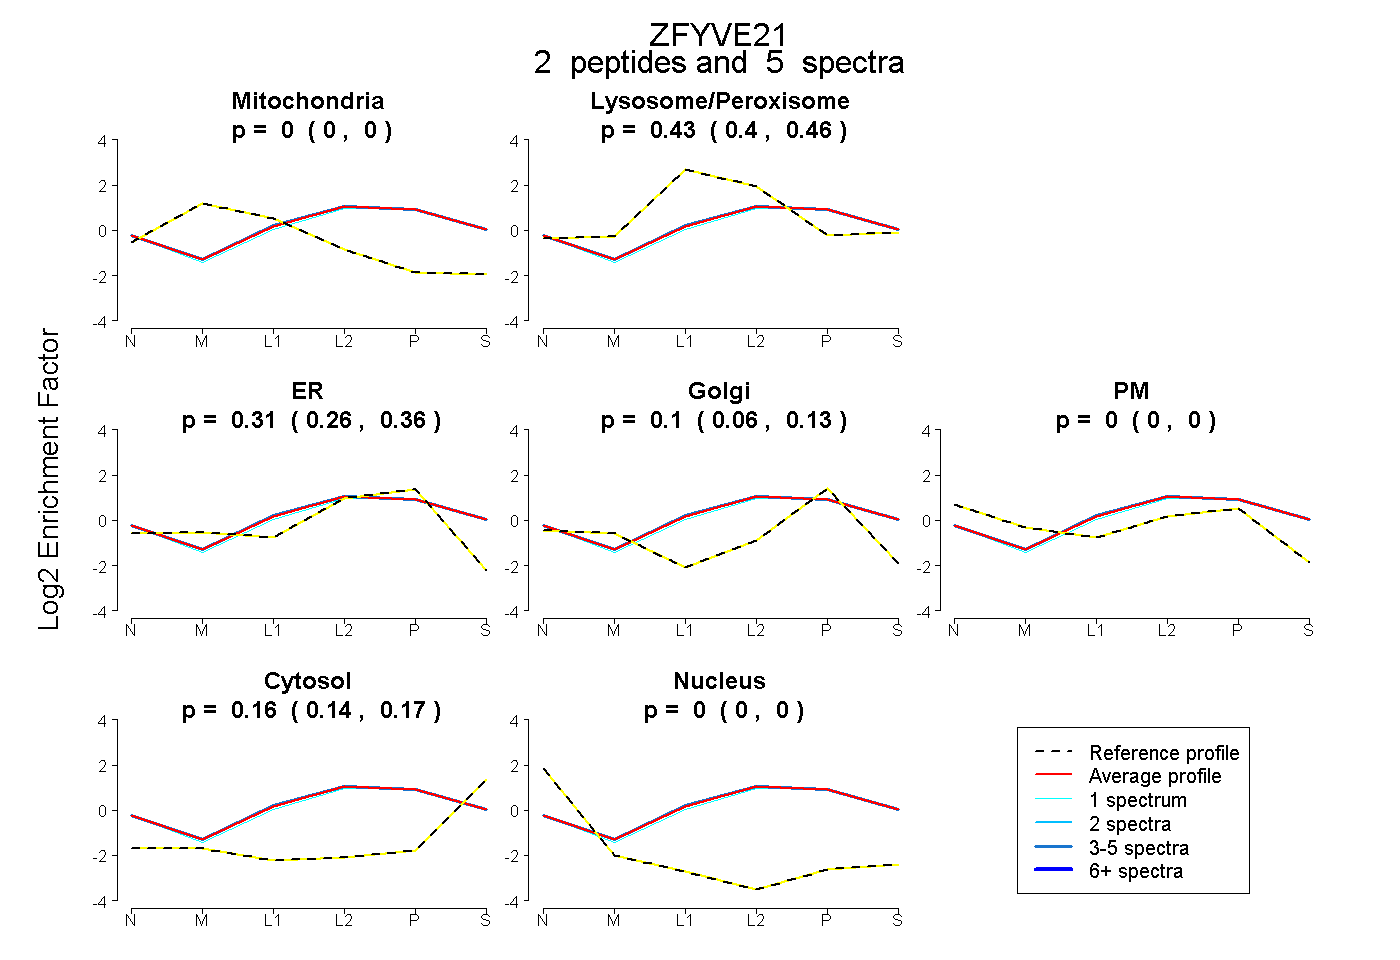 |
0.000 0.000 | 0.000 |
0.430 0.397 | 0.460 |
0.312 0.257 | 0.359 |
0.100 0.059 | 0.134 |
0.000 0.000 | 0.000 |
0.158 0.141 | 0.173 |
0.000 0.000 | 0.000 |
|||
| Plot | Lyso | Other | |||||||||||
| Expt C |
7 peptides |
34 spectra |
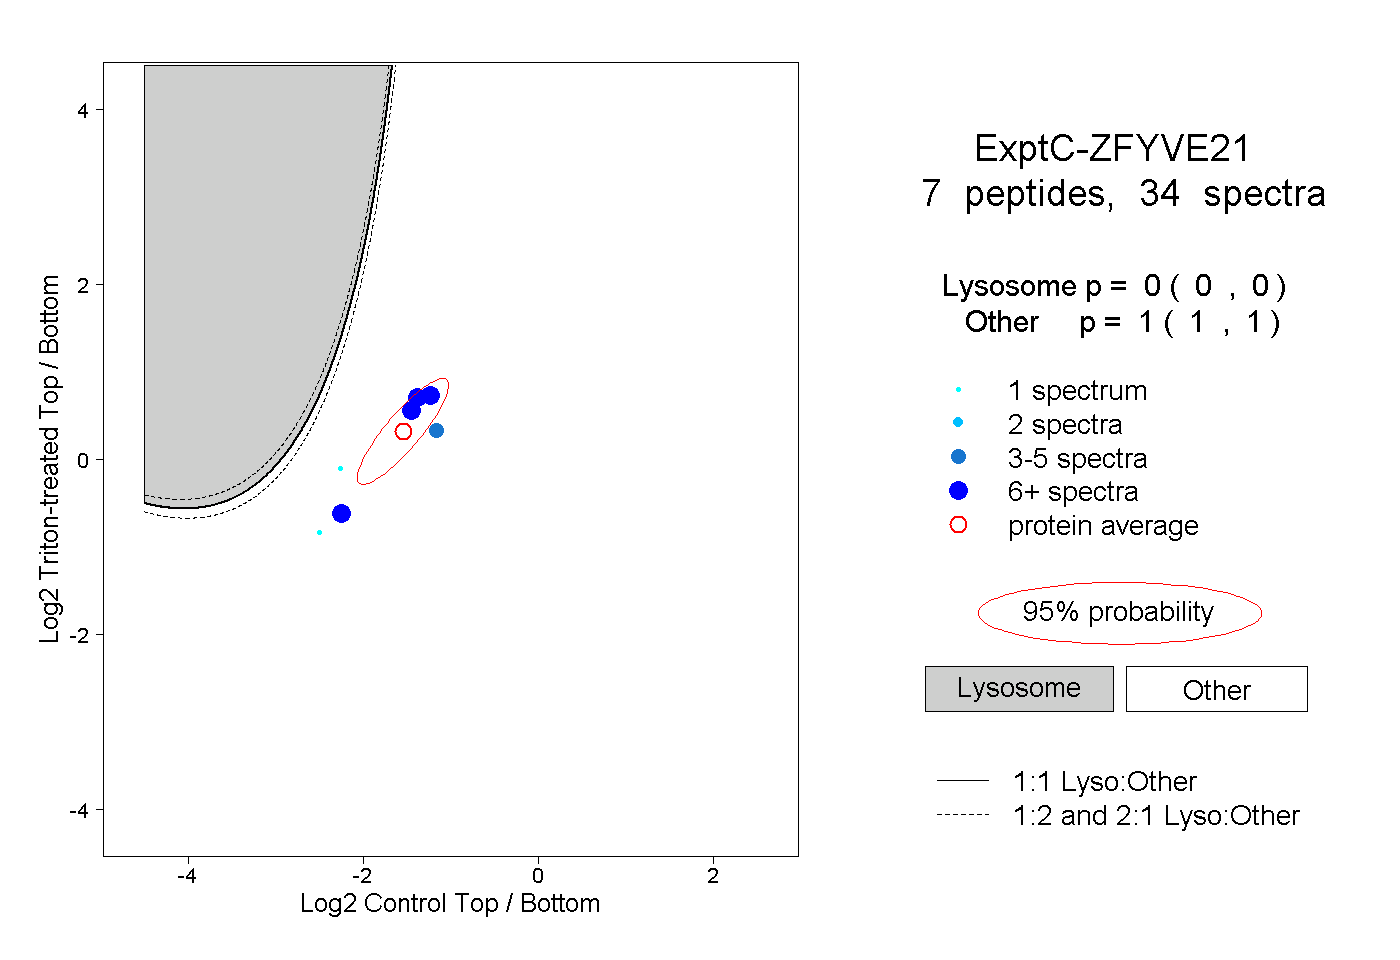 |
0.000 0.000 | 0.000 |
1.000 1.000 | 1.000 |
||||||||
| Plot | Lyso | Other | |||||||||||
| Expt D |
1 peptide |
1 spectrum |
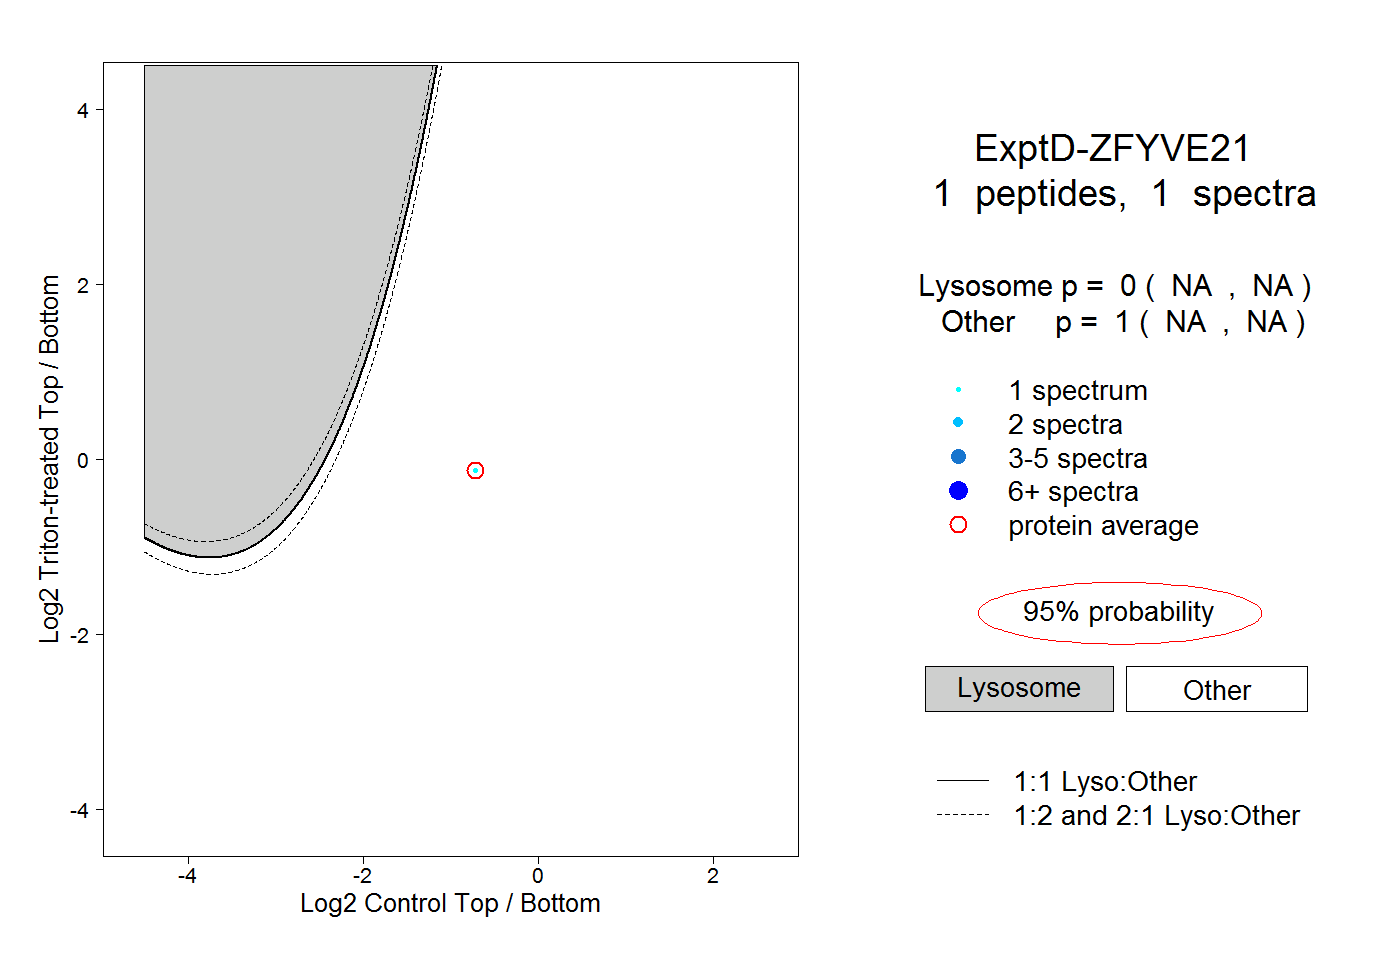 |
0.000 NA | NA |
1.000 NA | NA |