 27
27peptides
spectra
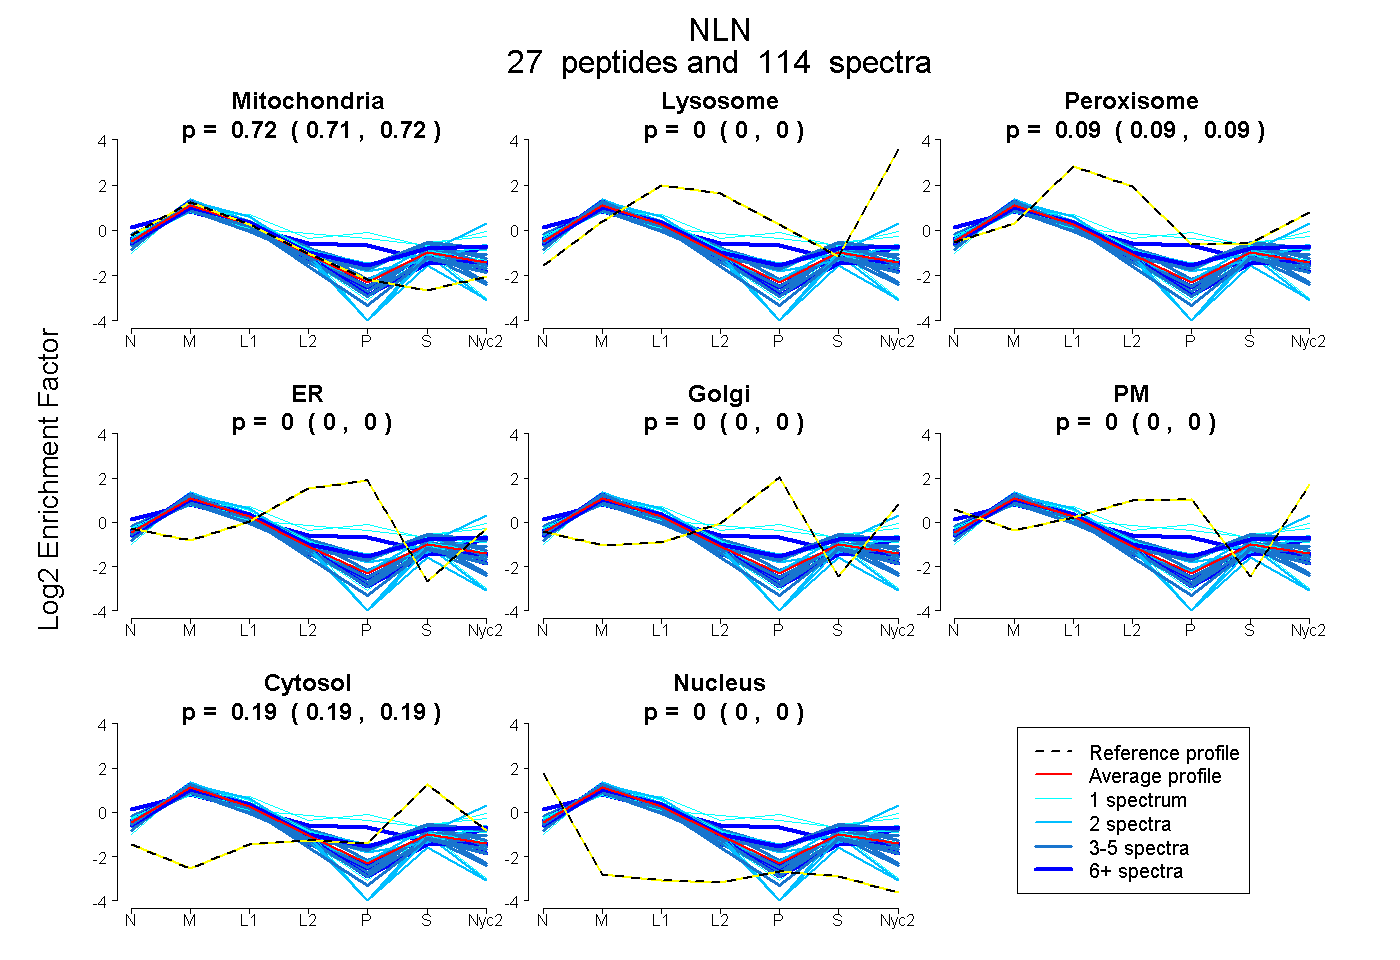
0.714 | 0.721
0.000 | 0.000
0.086 | 0.092
0.000 | 0.000
0.000 | 0.000
0.000 | 0.000
0.192 | 0.195
0.000 | 0.000
14peptides
spectra

0.616 | 0.636
0.124 | 0.141
0.000 | 0.000
0.000 | 0.000
0.000 | 0.000
0.235 | 0.244
0.000 | 0.000
28peptides
spectra
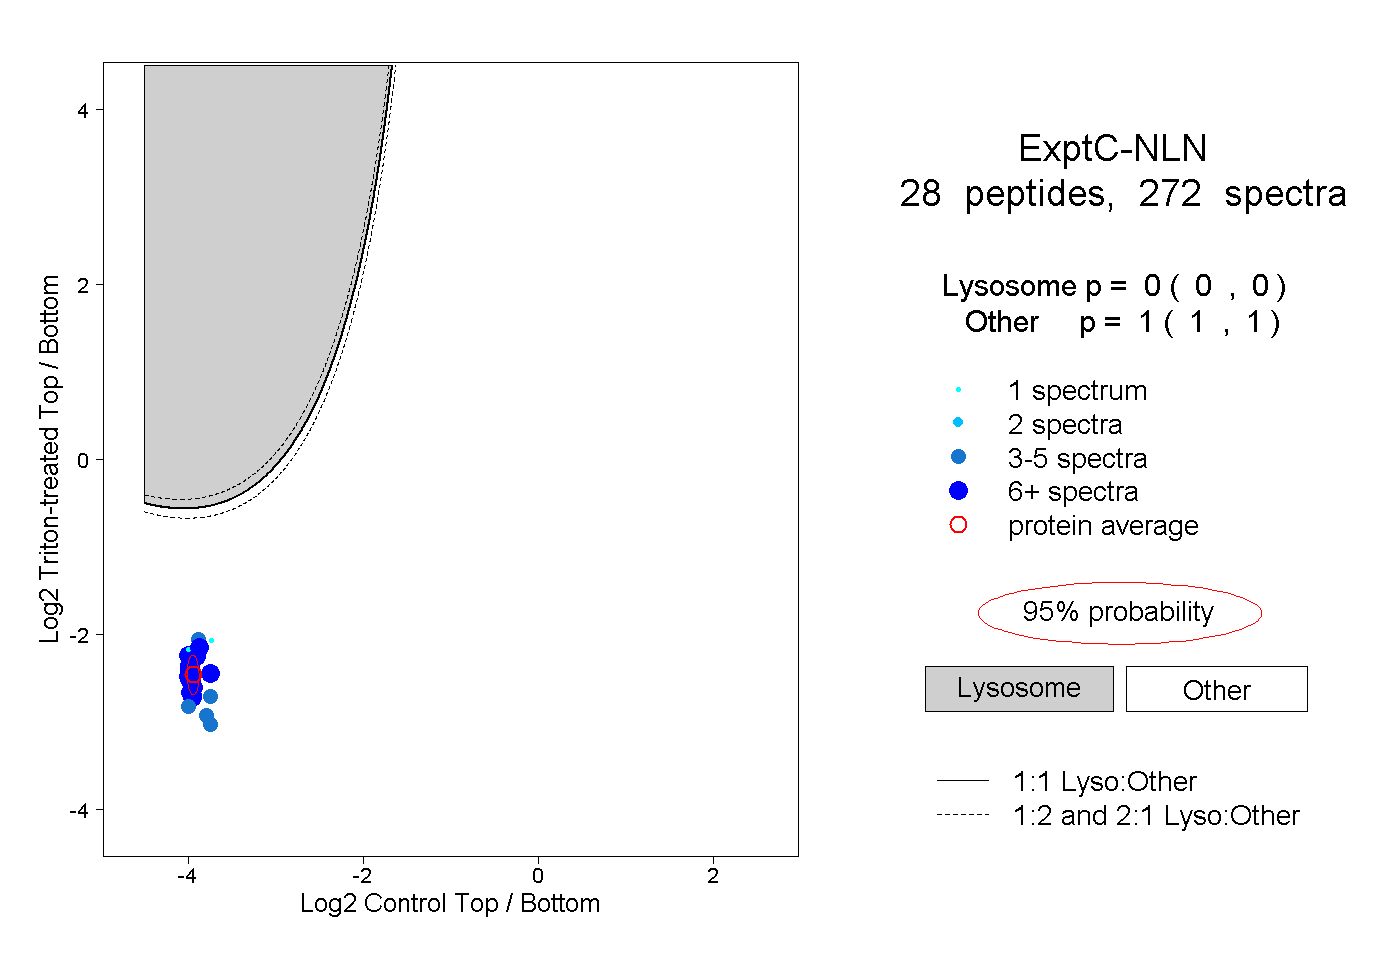
0.000 | 0.000
1.000 | 1.000
7peptides
spectra

0.000 | 0.000
1.000 | 1.000