 5
5peptides
spectra
0.000 | 0.015
0.000 | 0.131
0.000 | 0.062
0.000 | 0.000
0.000 | 0.000
0.000 | 0.000
0.861 | 0.923
0.000 | 0.000
1peptide
spectra

NA | NA
NA | NA
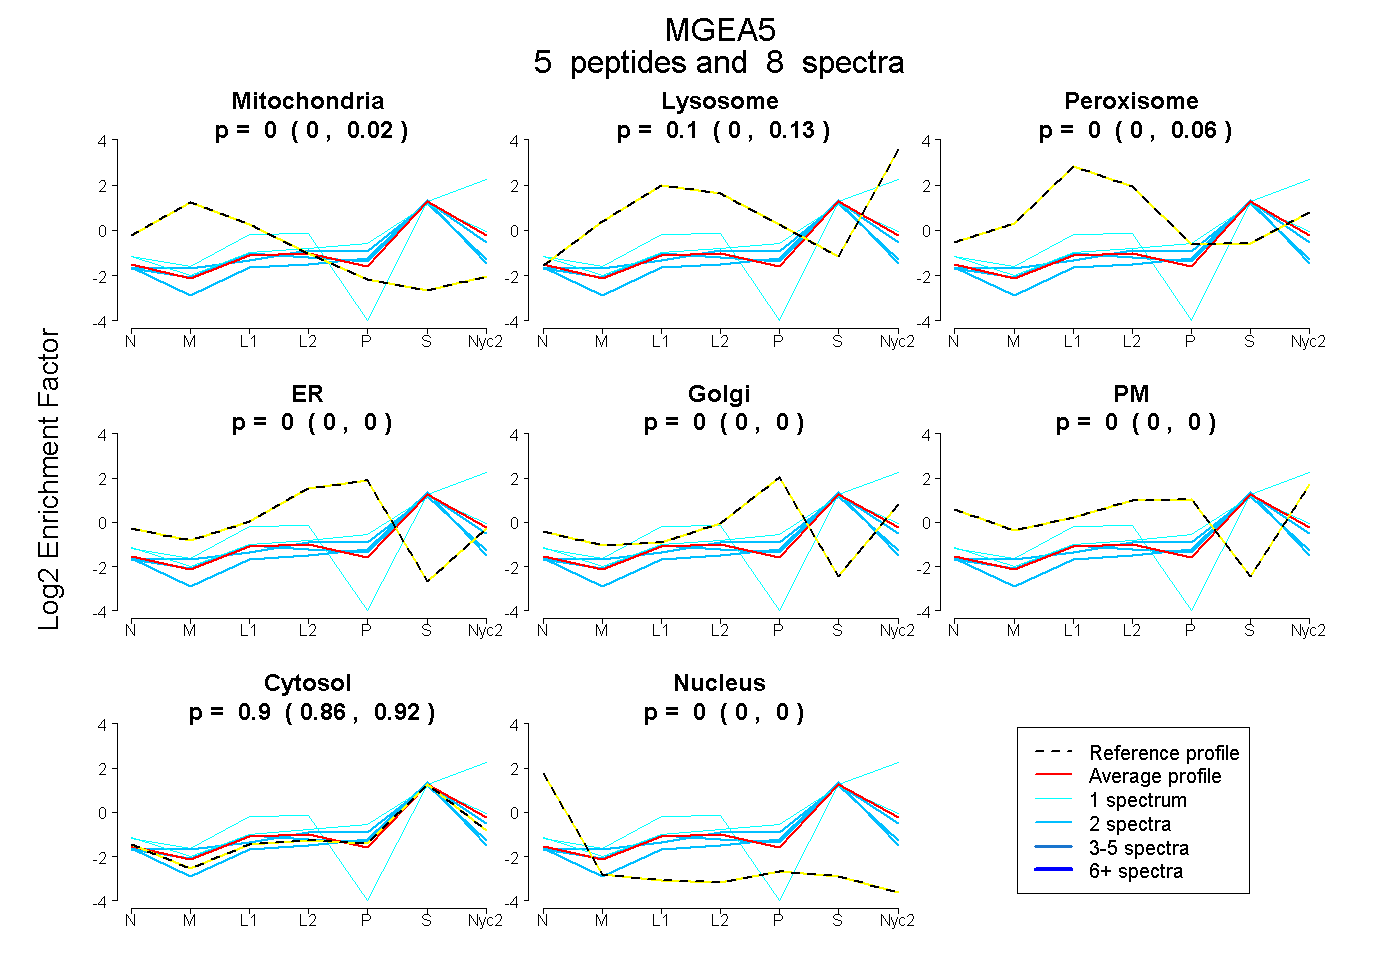
| Plot | Mito | Lyso | Perox | ER | Golgi | PM | Cytosol | Nucleus | |||||
| Expt A |
5 peptides |
8 spectra |
|
0.000 0.000 | 0.015 |
0.098 0.000 | 0.131 |
0.000 0.000 | 0.062 |
0.000 0.000 | 0.000 |
0.000 0.000 | 0.000 |
0.000 0.000 | 0.000 |
0.902 0.861 | 0.923 |
0.000 0.000 | 0.000 |
||
| Plot | Lyso | Other | |||||||||||
| Expt C |
1 peptide |
2 spectra |
|
0.000 NA | NA |
1.000 NA | NA |