 5
5peptides
spectra
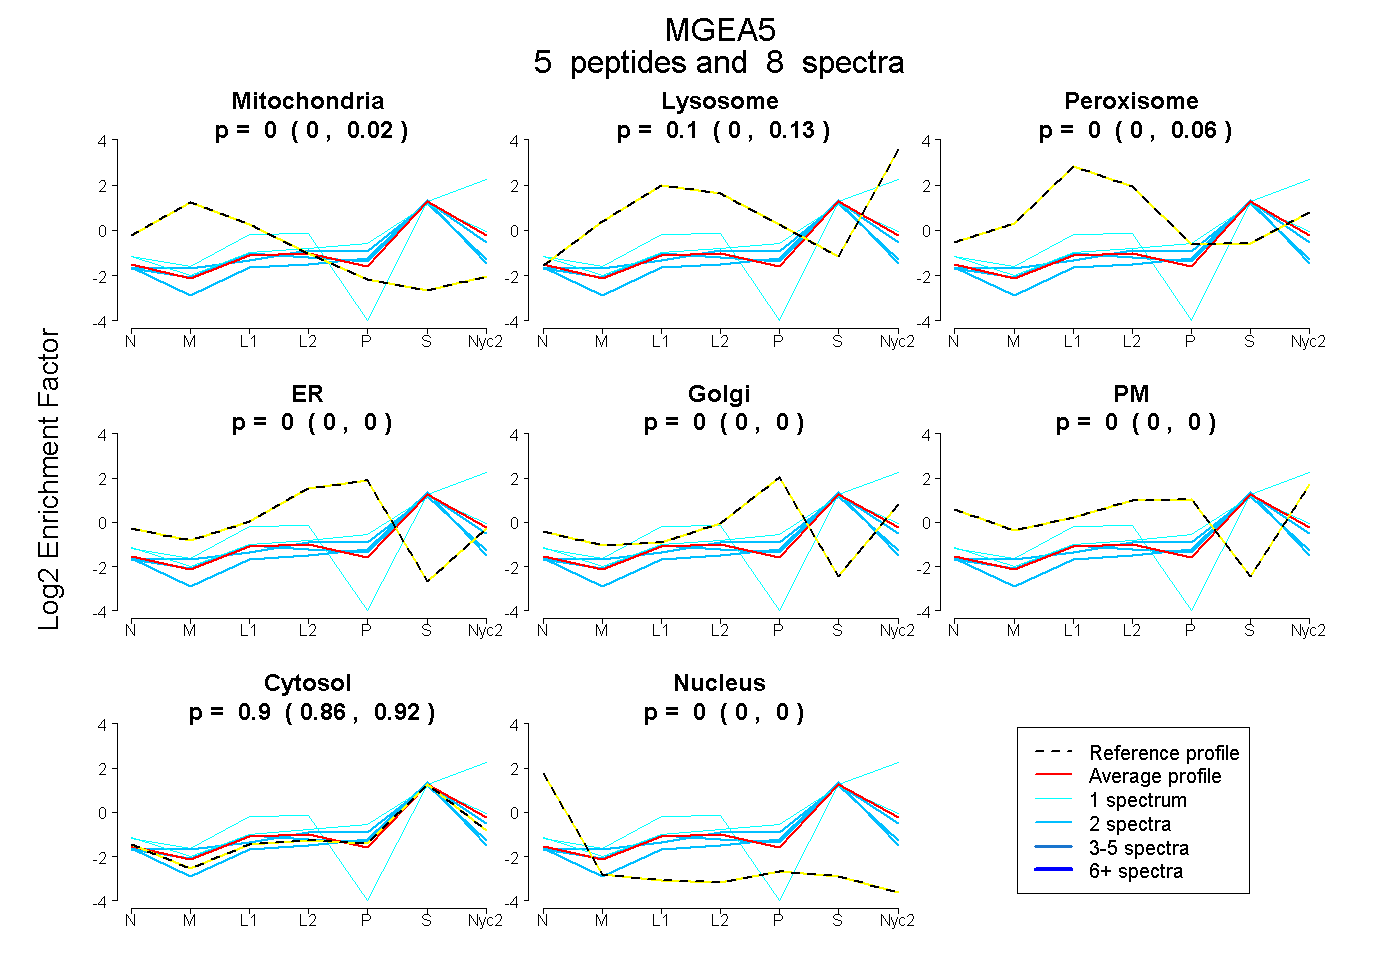
0.000 | 0.015
0.000 | 0.131
0.000 | 0.062
0.000 | 0.000
0.000 | 0.000
0.000 | 0.000
0.861 | 0.923
0.000 | 0.000
| Plot | Mito | Lyso | Perox | ER | Golgi | PM | Cytosol | Nucleus | |||||
| Expt A |
5 peptides |
8 spectra |
|
0.000 0.000 | 0.015 |
0.098 0.000 | 0.131 |
0.000 0.000 | 0.062 |
0.000 0.000 | 0.000 |
0.000 0.000 | 0.000 |
0.000 0.000 | 0.000 |
0.902 0.861 | 0.923 |
0.000 0.000 | 0.000 |
| 2 spectra, EFQWLR | 0.000 | 0.070 | 0.008 | 0.000 | 0.000 | 0.000 | 0.922 | 0.000 | ||
| 1 spectrum, STELIPR | 0.000 | 0.129 | 0.000 | 0.000 | 0.072 | 0.000 | 0.799 | 0.000 | ||
| 2 spectra, ESQAALEER | 0.000 | 0.000 | 0.000 | 0.000 | 0.000 | 0.000 | 0.965 | 0.035 | ||
| 1 spectrum, EIPVESIEEVSK | 0.000 | 0.343 | 0.000 | 0.000 | 0.000 | 0.000 | 0.657 | 0.000 | ||
| 2 spectra, SFVQWLGCR | 0.063 | 0.000 | 0.006 | 0.057 | 0.000 | 0.000 | 0.873 | 0.000 |
| Plot | Lyso | Other | |||||||||||
| Expt C |
1 peptide |
2 spectra |
 |
0.000 NA | NA |
1.000 NA | NA |