 9
9peptides
spectra
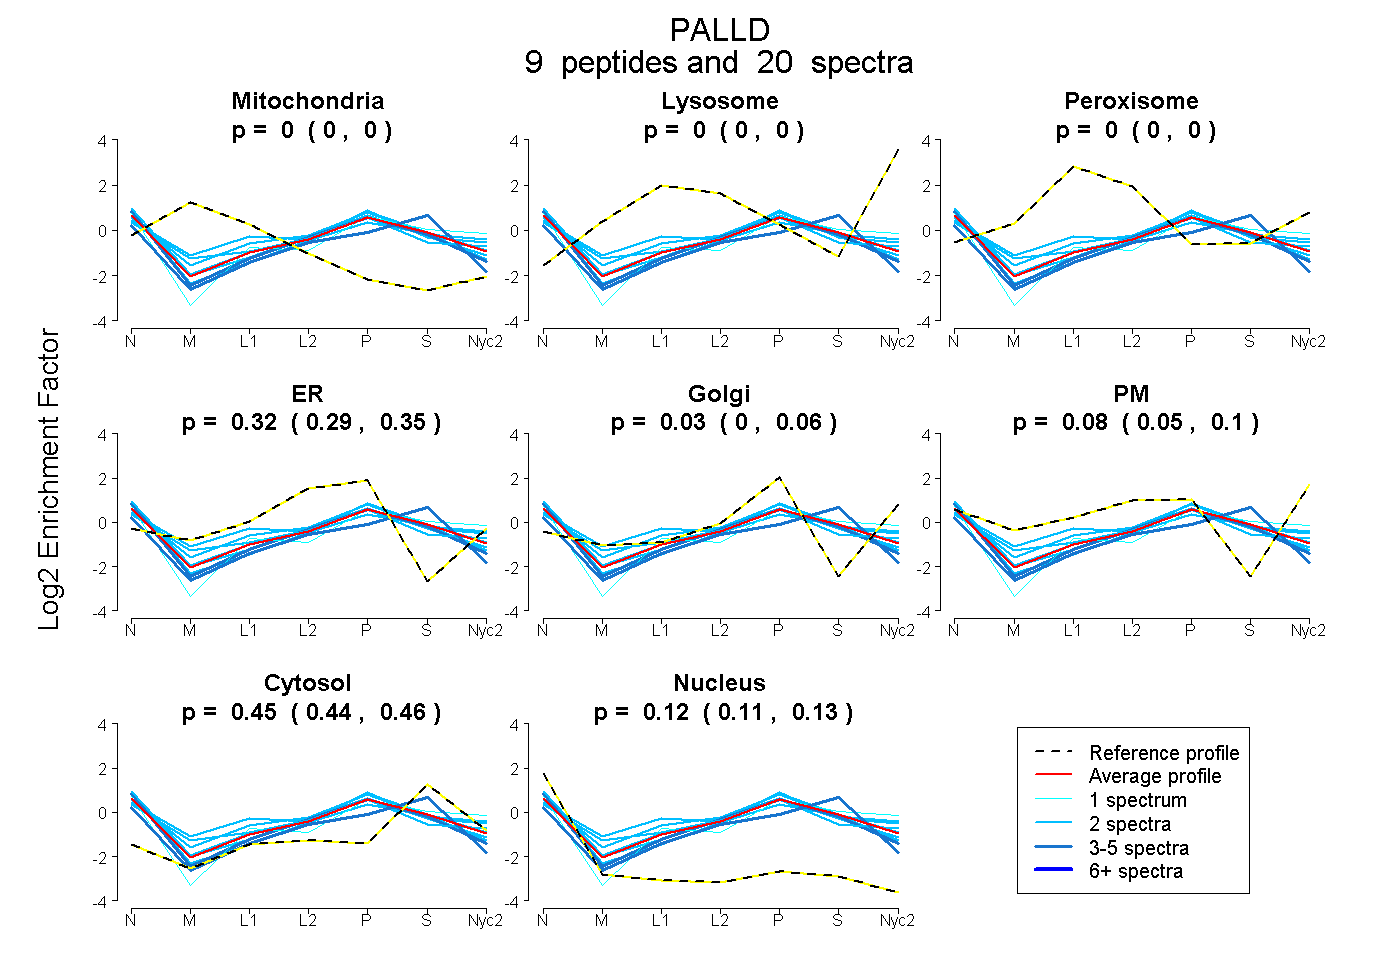
0.000 | 0.000
0.000 | 0.000
0.000 | 0.000
0.294 | 0.348
0.003 | 0.056
0.048 | 0.101
0.437 | 0.456
0.112 | 0.127
2peptides
spectra
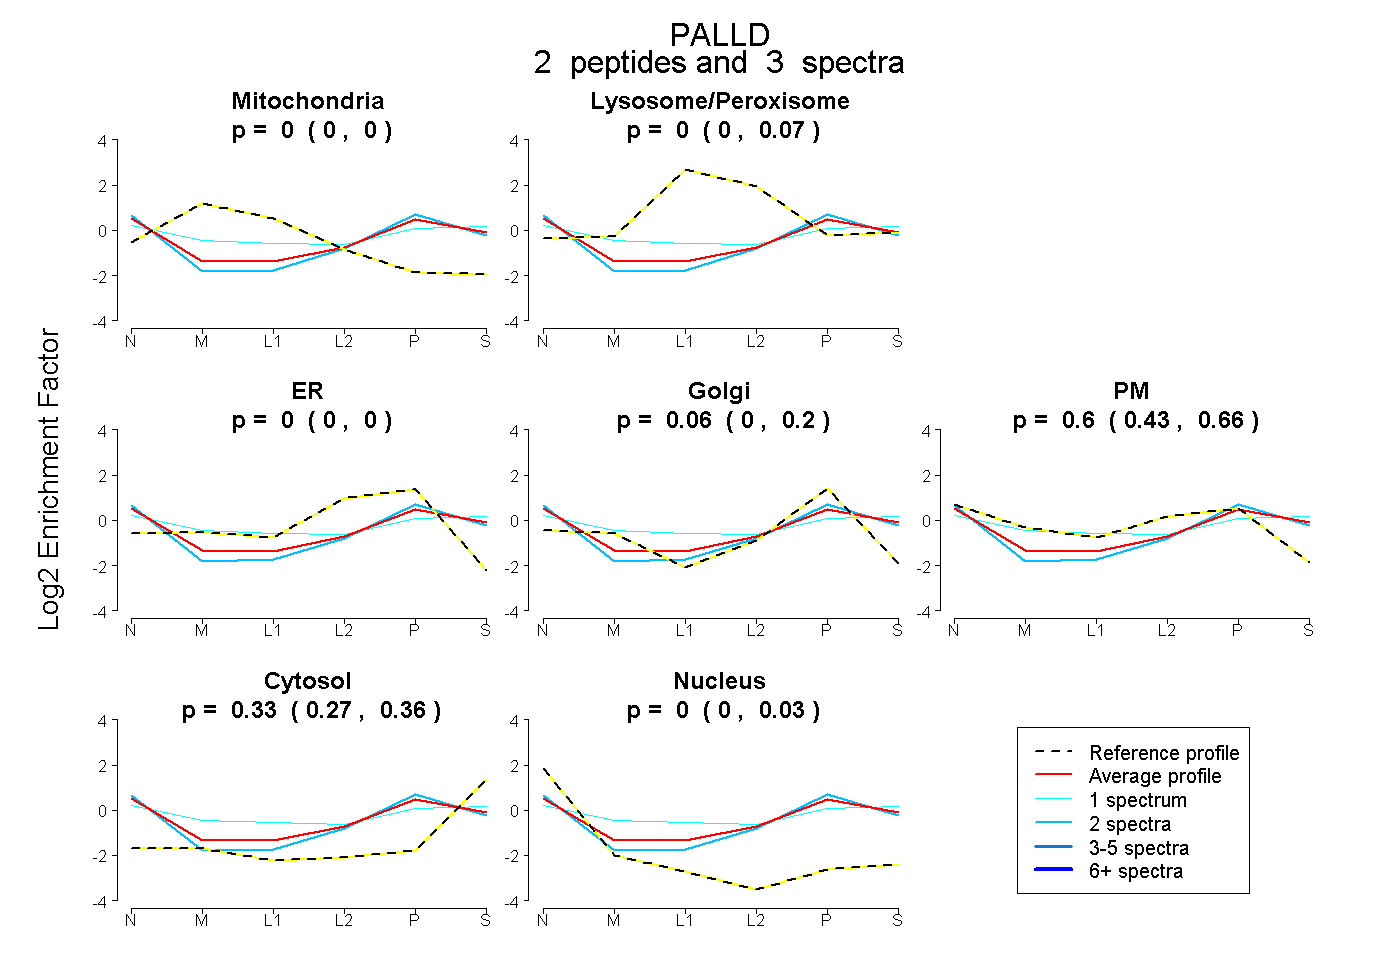
0.000 | 0.000
0.000 | 0.069
0.000 | 0.000
0.000 | 0.198
0.427 | 0.655
0.274 | 0.364
0.000 | 0.026
5peptides
spectra
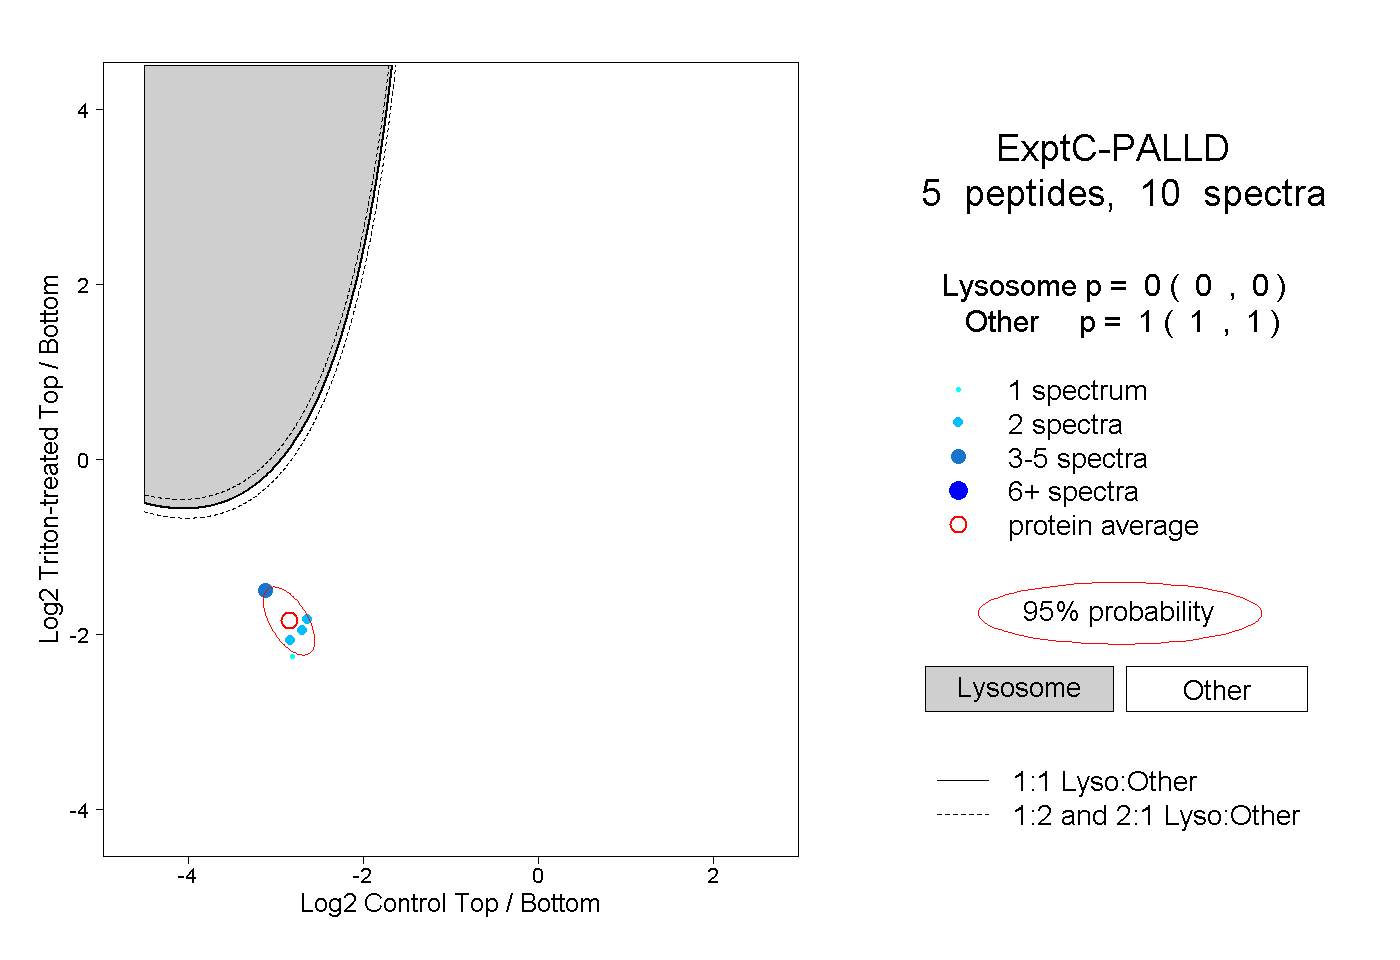
0.000 | 0.000
1.000 | 1.000
2peptides
spectra
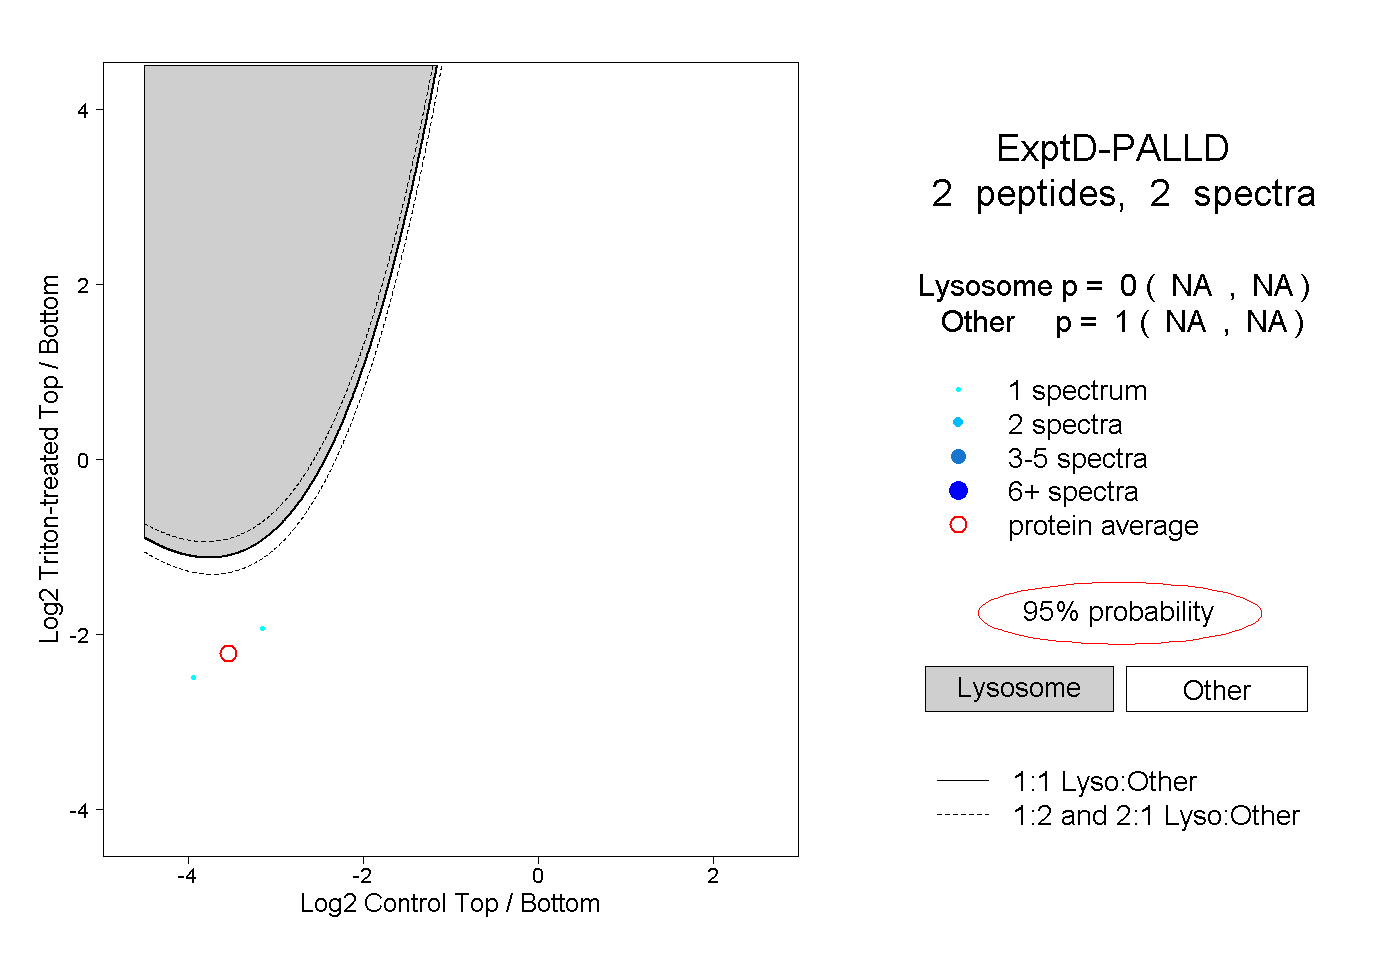
NA | NA
NA | NA