 9
9peptides
spectra
0.000 | 0.000
0.000 | 0.000
0.000 | 0.000
0.294 | 0.348
0.003 | 0.056
0.048 | 0.101
0.437 | 0.456
0.112 | 0.127
| Plot | Mito | Lyso | Perox | ER | Golgi | PM | Cytosol | Nucleus | |||||
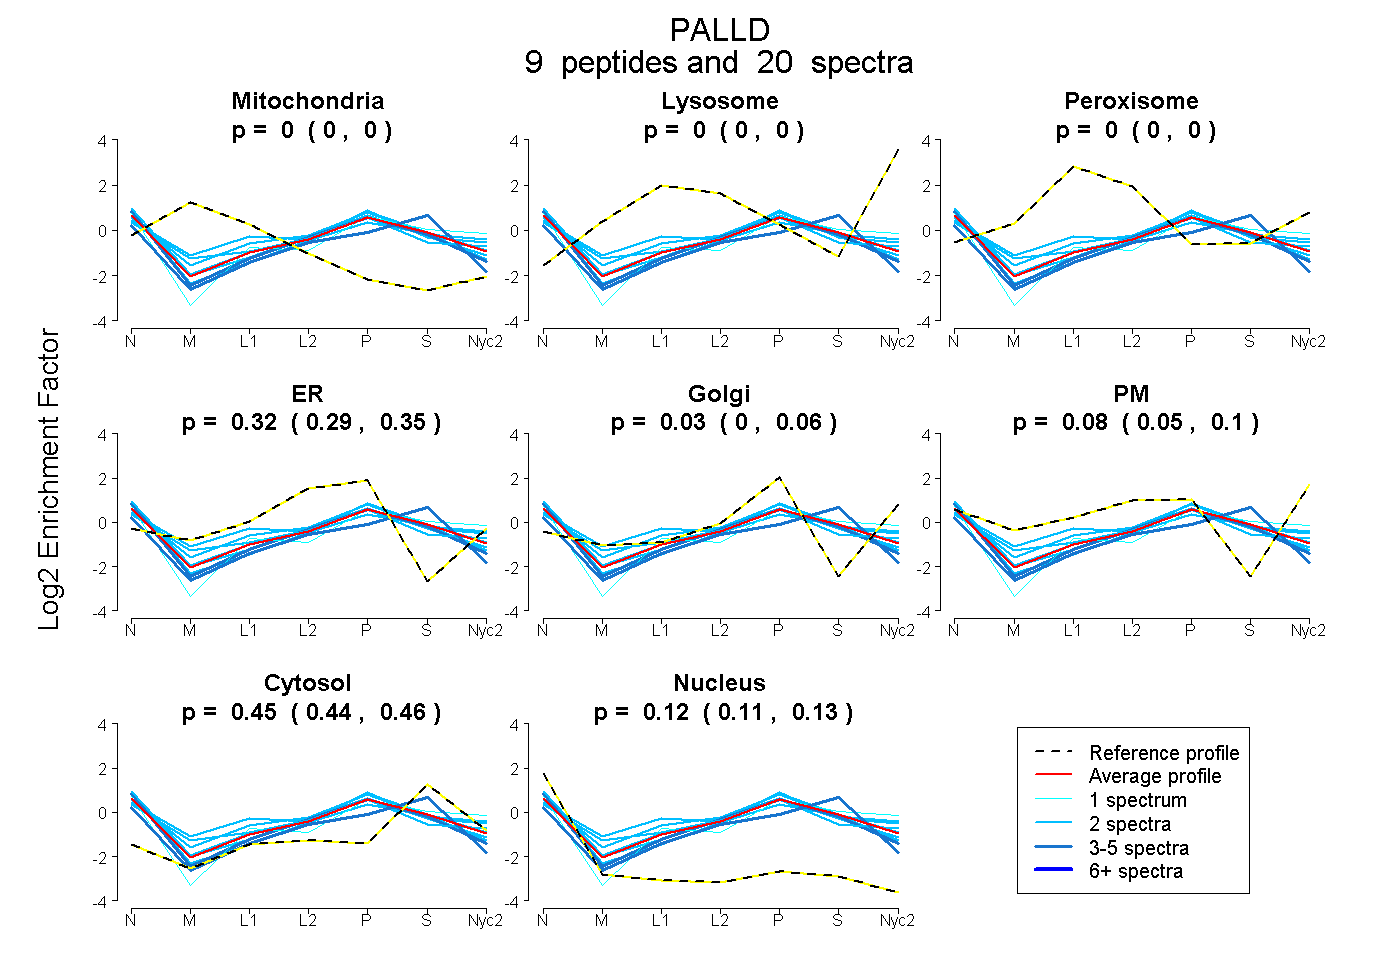
| Expt A |
9 peptides |
20 spectra |
|
0.000 0.000 | 0.000 |
0.000 0.000 | 0.000 |
0.000 0.000 | 0.000 |
0.324 0.294 | 0.348 |
0.032 0.003 | 0.056 |
0.077 0.048 | 0.101 |
0.447 0.437 | 0.456 |
0.121 0.112 | 0.127 |
| 2 spectra, GVTPAGFPK | 0.000 | 0.000 | 0.164 | 0.135 | 0.301 | 0.022 | 0.297 | 0.080 | ||
| 4 spectra, LMVQAVNQR | 0.000 | 0.000 | 0.000 | 0.405 | 0.000 | 0.000 | 0.415 | 0.180 | ||
| 2 spectra, VSGVPPPQIFWK | 0.000 | 0.000 | 0.000 | 0.238 | 0.034 | 0.225 | 0.339 | 0.164 | ||
| 1 spectrum, LTYEER | 0.000 | 0.000 | 0.000 | 0.000 | 0.264 | 0.144 | 0.510 | 0.083 | ||
| 3 spectra, VSSCEQR | 0.000 | 0.000 | 0.000 | 0.220 | 0.000 | 0.000 | 0.639 | 0.141 | ||
| 2 spectra, DAVIQDLER | 0.000 | 0.000 | 0.000 | 0.236 | 0.043 | 0.254 | 0.417 | 0.050 | ||
| 2 spectra, LISEIEYR | 0.000 | 0.000 | 0.000 | 0.340 | 0.011 | 0.019 | 0.434 | 0.196 | ||
| 2 spectra, DAGIYTCIATNR | 0.000 | 0.000 | 0.000 | 0.355 | 0.112 | 0.037 | 0.430 | 0.066 | ||
| 2 spectra, APVFIEK | 0.000 | 0.000 | 0.000 | 0.383 | 0.036 | 0.030 | 0.396 | 0.155 |
| Plot | Mito | Lyso or Perox | ER | Golgi | PM | Cytosol | Nucleus | ||||||
| Expt B |
2 peptides |
3 spectra |
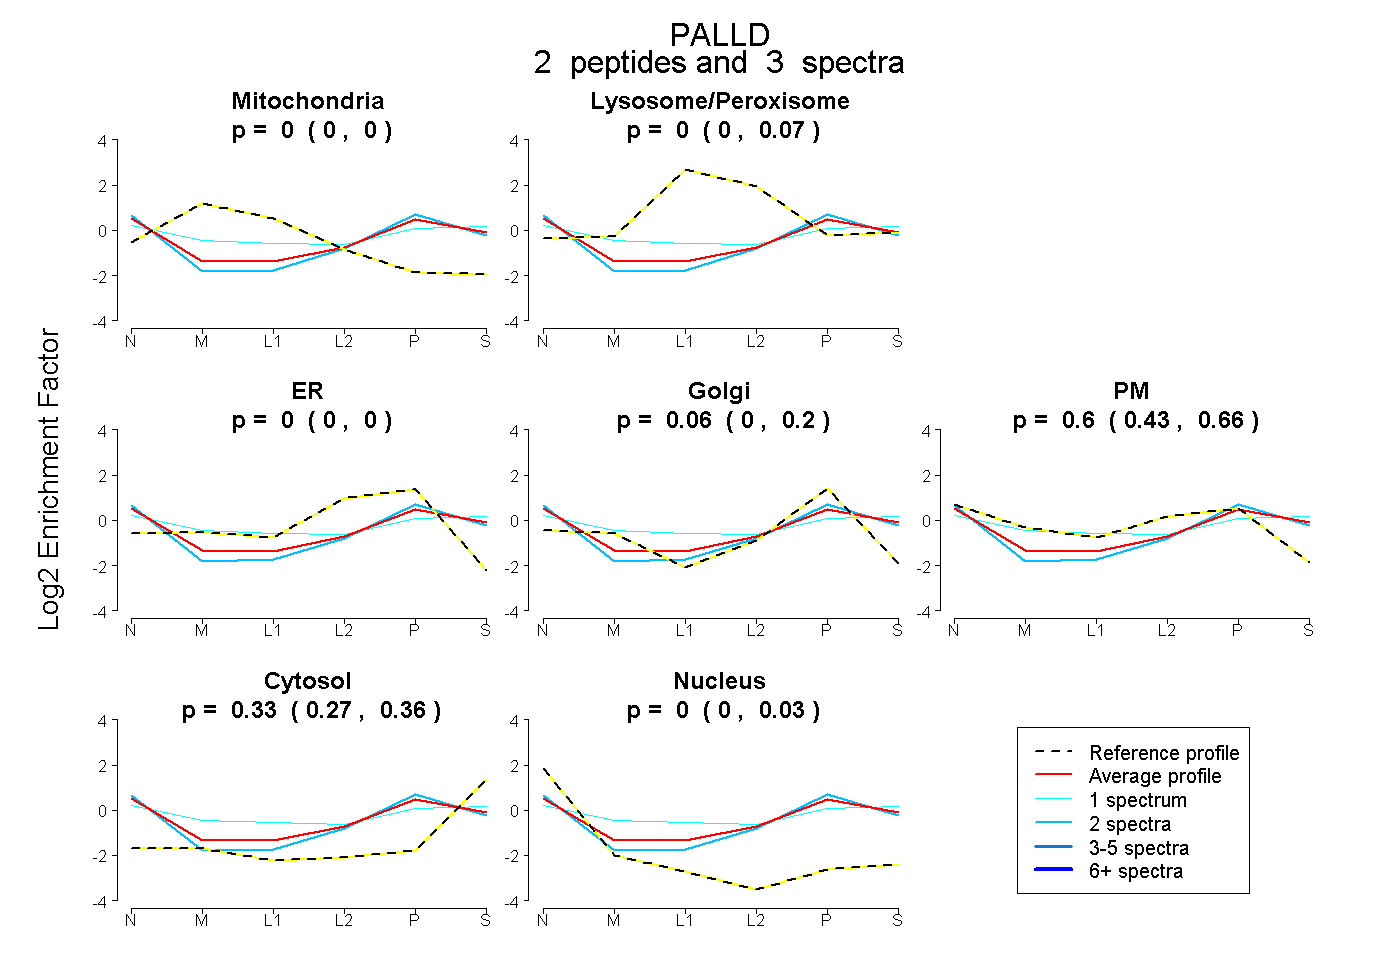 |
0.000 0.000 | 0.000 |
0.000 0.000 | 0.069 |
0.000 0.000 | 0.000 |
0.064 0.000 | 0.198 |
0.602 0.427 | 0.655 |
0.334 0.274 | 0.364 |
0.000 0.000 | 0.026 |
|||
| Plot | Lyso | Other | |||||||||||
| Expt C |
5 peptides |
10 spectra |
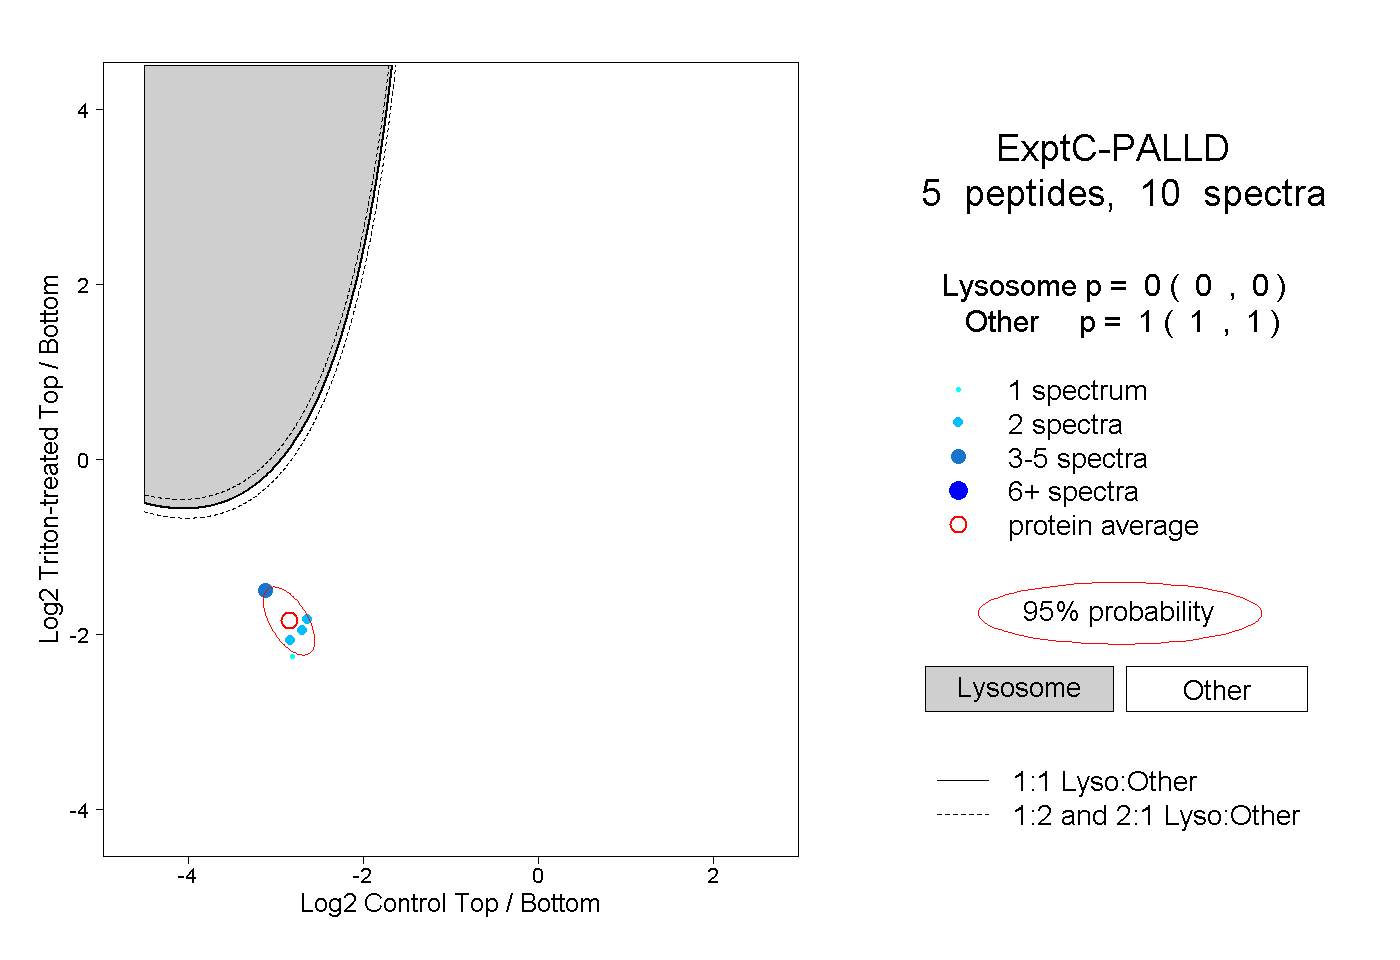 |
0.000 0.000 | 0.000 |
1.000 1.000 | 1.000 |
||||||||
| Plot | Lyso | Other | |||||||||||
| Expt D |
2 peptides |
2 spectra |
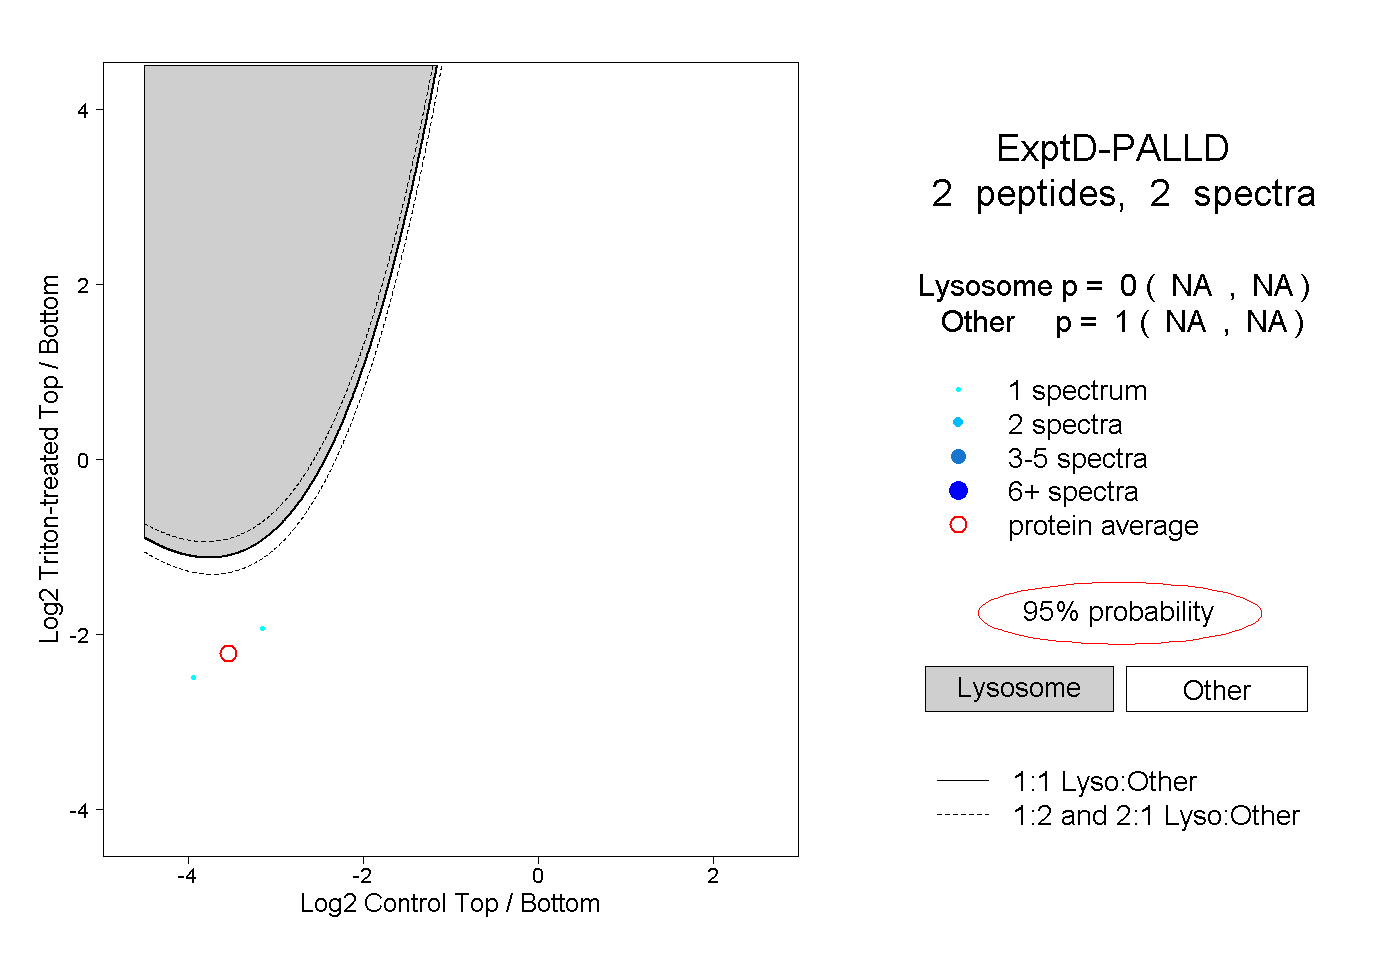 |
0.000 NA | NA |
1.000 NA | NA |