 45
45peptides
spectra

0.000 | 0.000
0.000 | 0.000
0.024 | 0.030
0.181 | 0.194
0.000 | 0.000
0.699 | 0.716
0.008 | 0.019
0.058 | 0.065
7peptides
spectra

0.000 | 0.000
0.000 | 0.000
0.000 | 0.000
0.038 | 0.122
0.785 | 0.846
0.000 | 0.069
0.037 | 0.085
40peptides
spectra
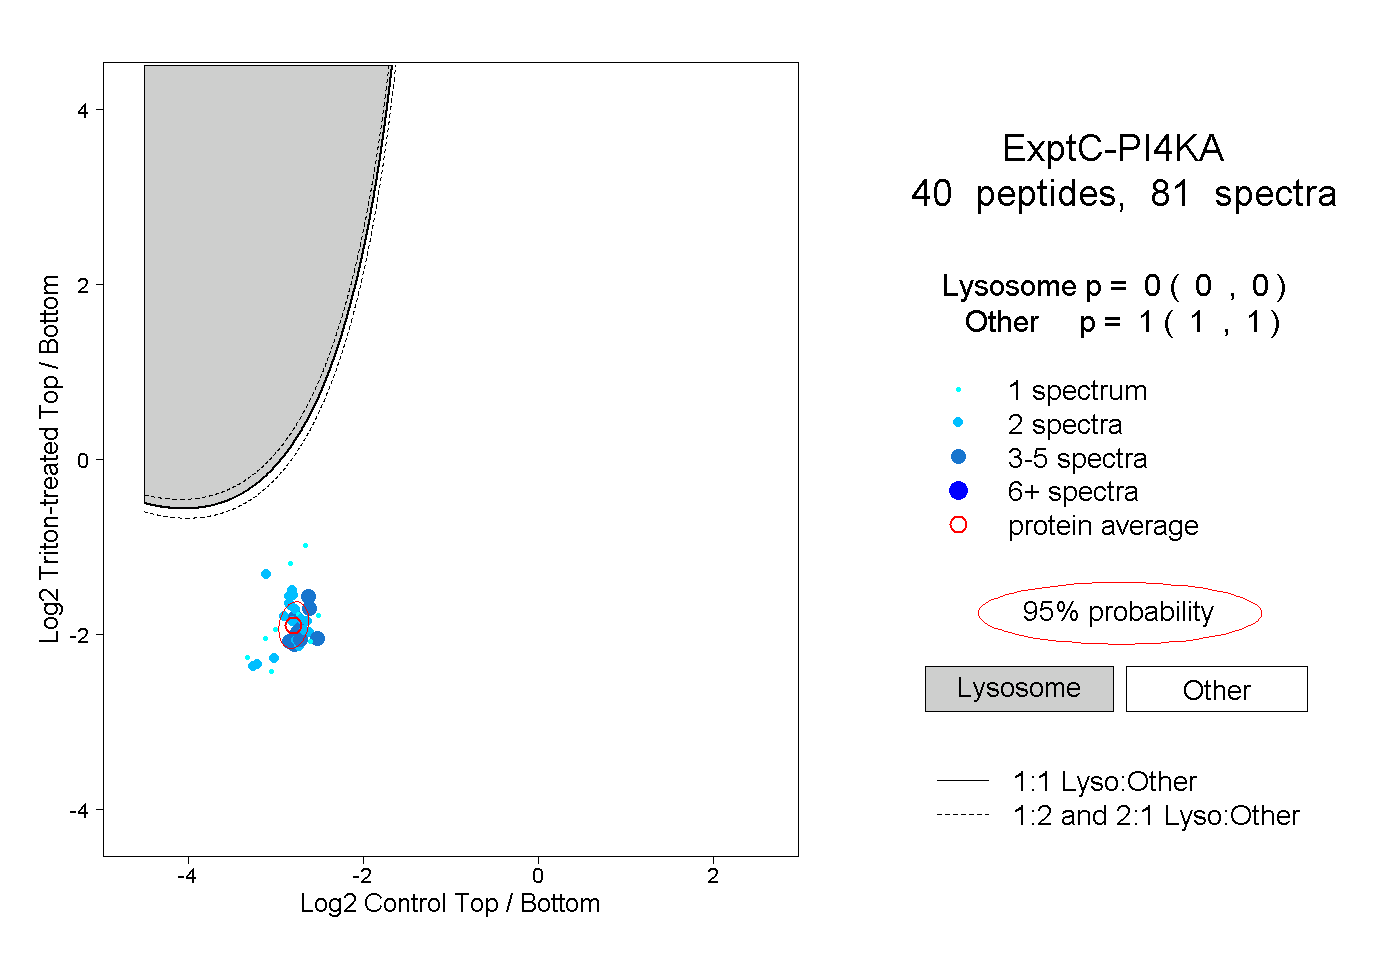
0.000 | 0.000
1.000 | 1.000
4peptides
spectra
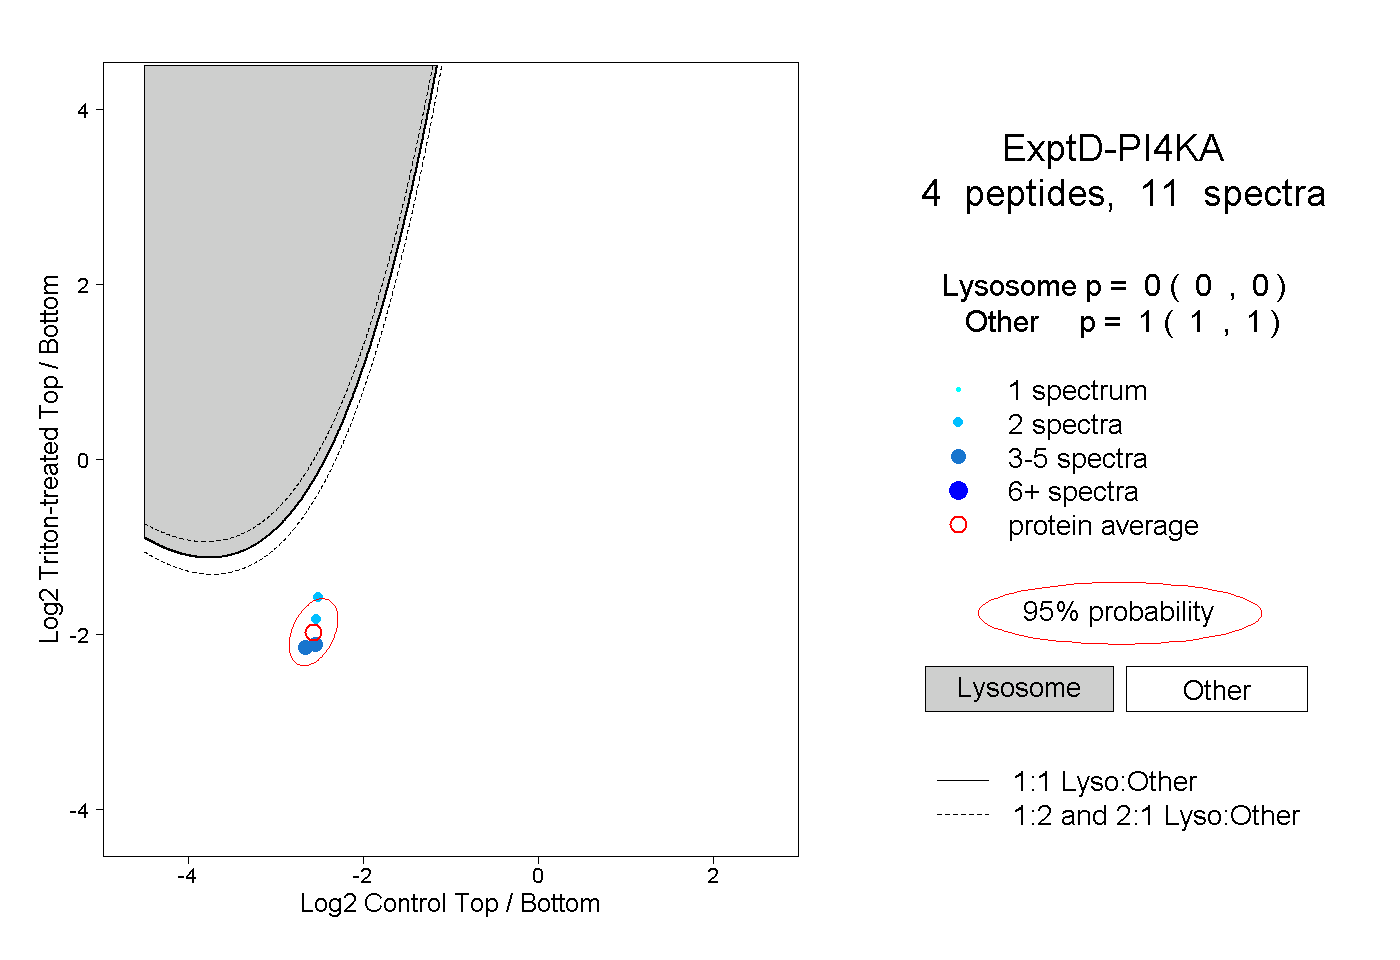
0.000 | 0.000
1.000 | 1.000