 16
16peptides
spectra
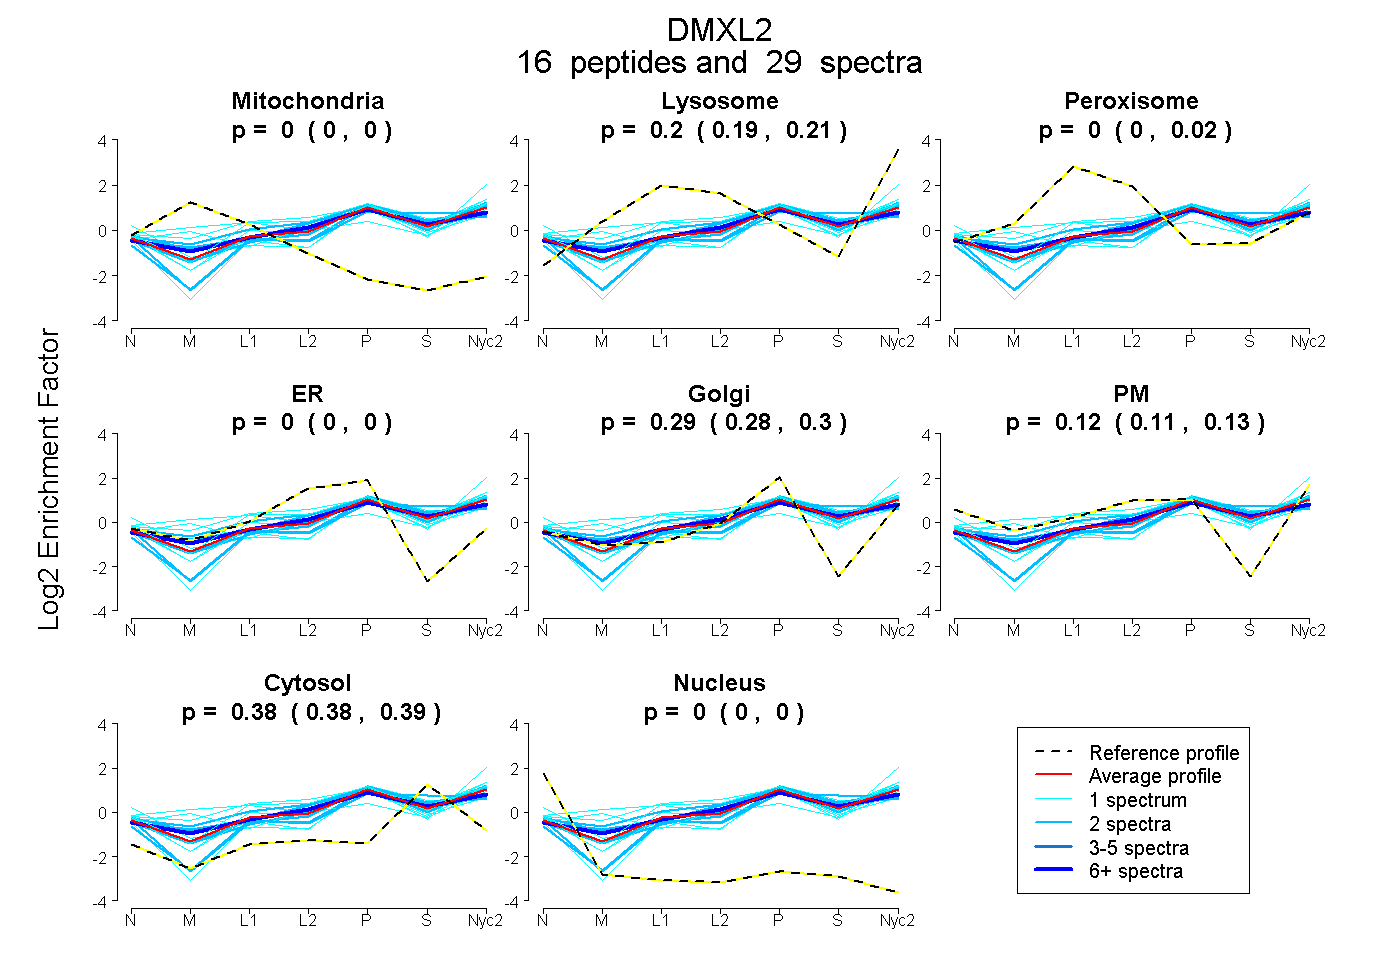
0.000 | 0.000
0.191 | 0.207
0.000 | 0.015
0.000 | 0.000
0.280 | 0.301
0.107 | 0.132
0.376 | 0.389
0.000 | 0.000
5peptides
spectra
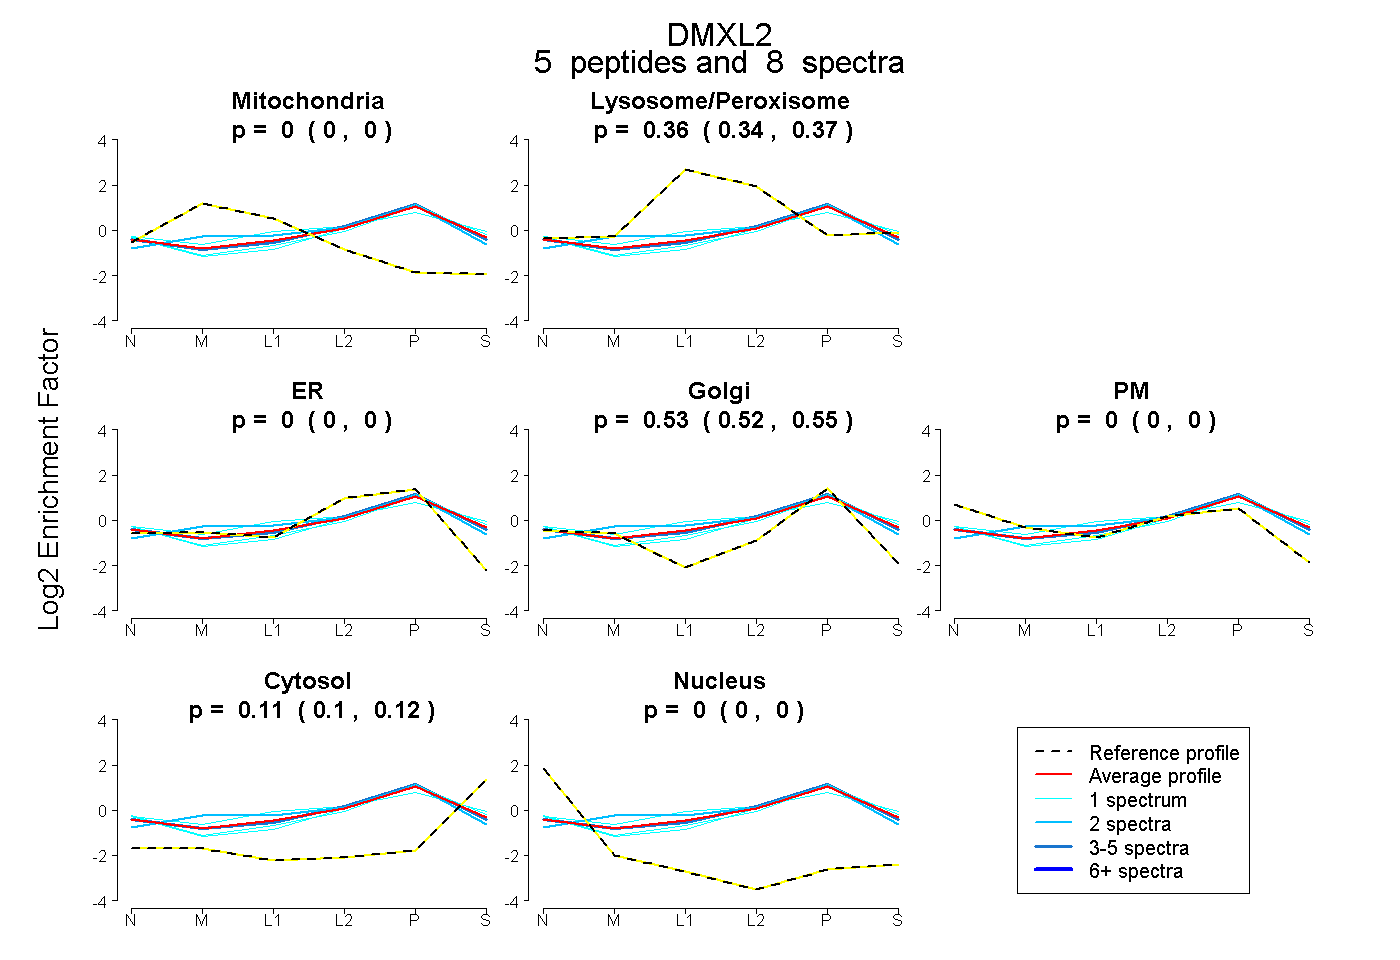
0.000 | 0.000
0.344 | 0.369
0.000 | 0.000
0.517 | 0.547
0.000 | 0.000
0.096 | 0.120
0.000 | 0.000
9peptides
spectra
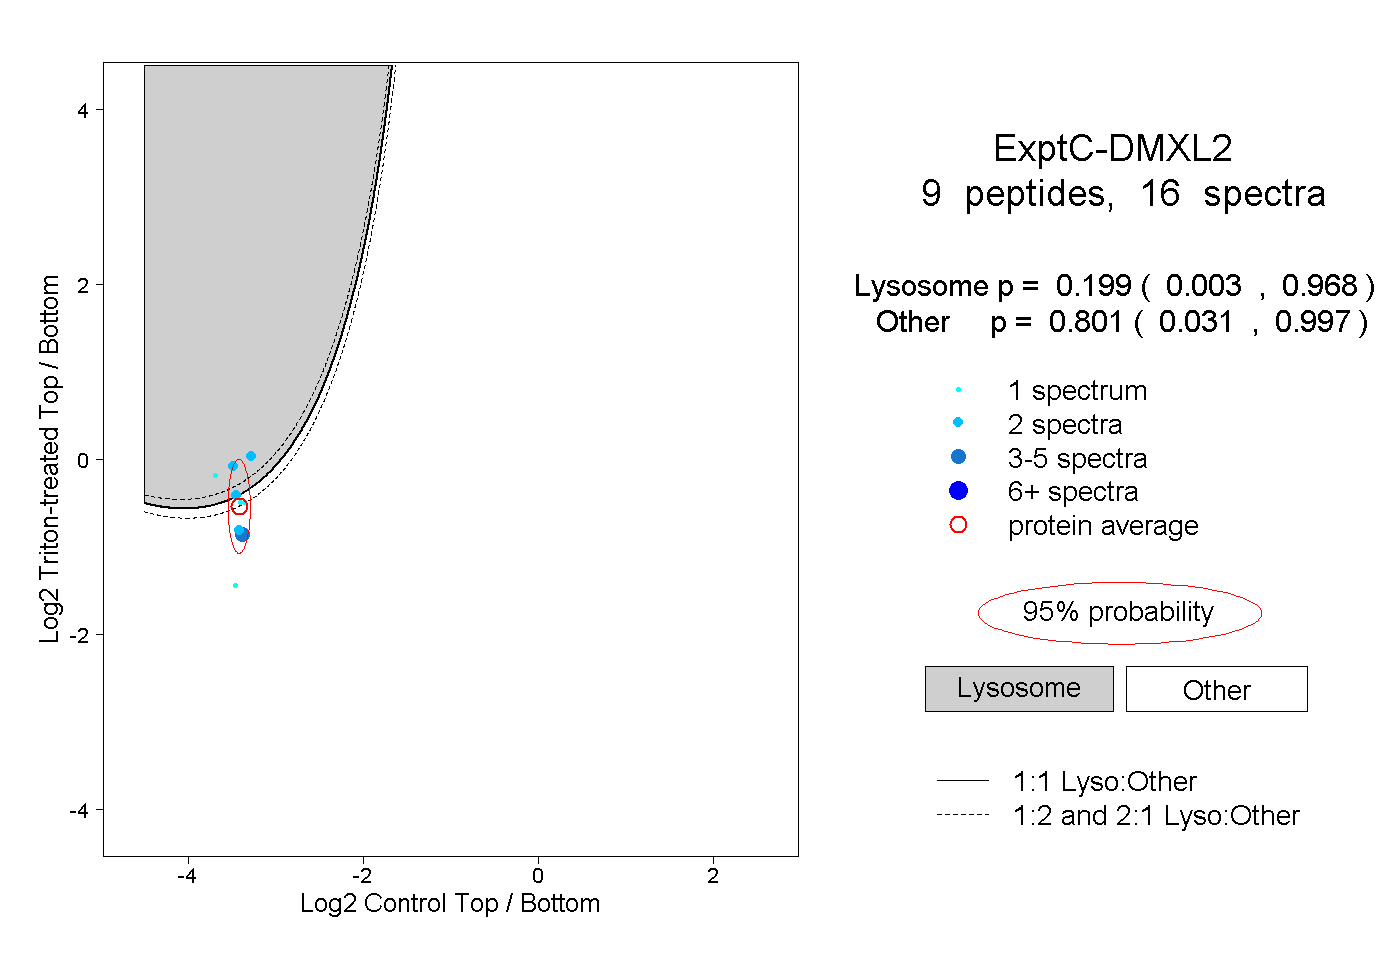
0.003 | 0.968
0.031 | 0.997
3peptides
spectra
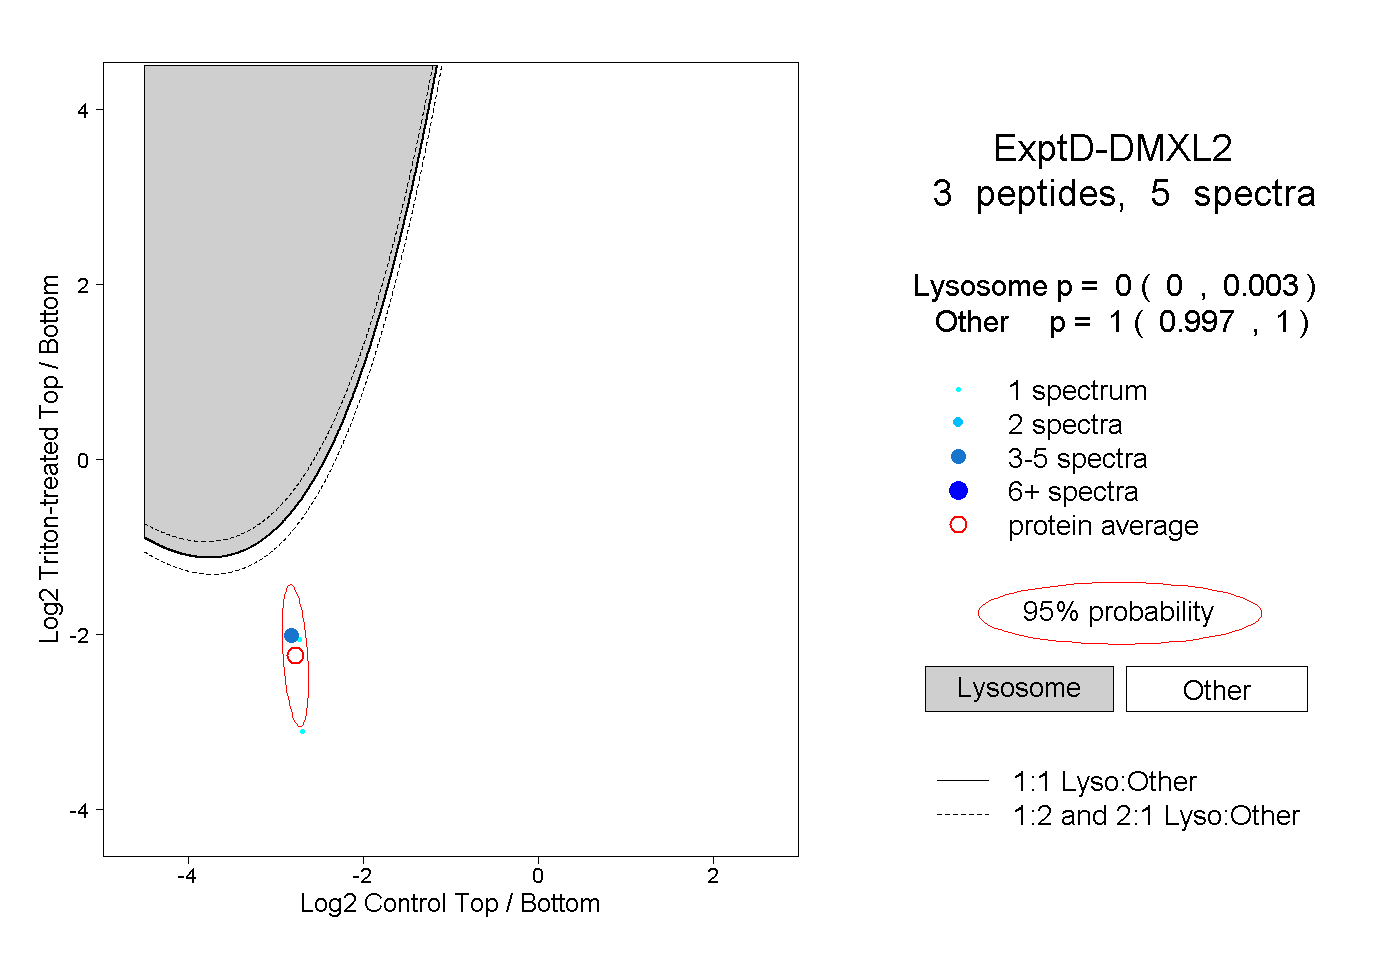
0.000 | 0.003
0.997 | 1.000