 16
16peptides
spectra
0.000 | 0.000
0.191 | 0.207
0.000 | 0.015
0.000 | 0.000
0.280 | 0.301
0.107 | 0.132
0.376 | 0.389
0.000 | 0.000
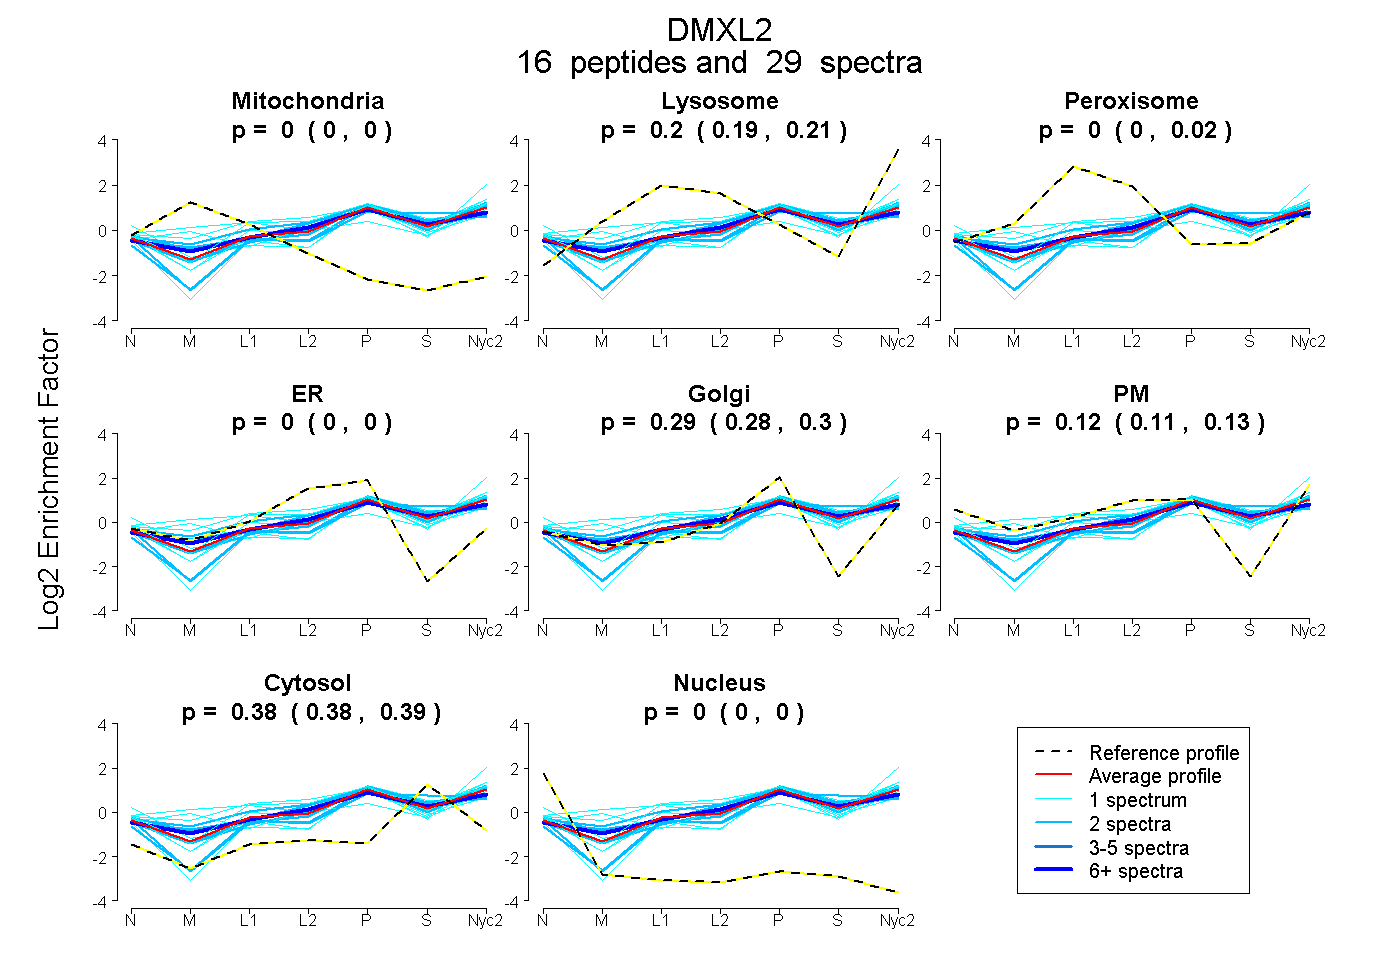
| Plot | Mito | Lyso | Perox | ER | Golgi | PM | Cytosol | Nucleus | |||||
| Expt A |
16 peptides |
29 spectra |
|
0.000 0.000 | 0.000 |
0.200 0.191 | 0.207 |
0.004 0.000 | 0.015 |
0.000 0.000 | 0.000 |
0.290 0.280 | 0.301 |
0.122 0.107 | 0.132 |
0.383 0.376 | 0.389 |
0.000 0.000 | 0.000 |
| 2 spectra, LALHNIK | 0.000 | 0.110 | 0.123 | 0.000 | 0.381 | 0.000 | 0.386 | 0.000 | ||
| 1 spectrum, LHPDPFLR | 0.049 | 0.141 | 0.178 | 0.000 | 0.090 | 0.282 | 0.260 | 0.000 | ||
| 1 spectrum, ILMTELR | 0.000 | 0.000 | 0.000 | 0.000 | 0.283 | 0.314 | 0.403 | 0.000 | ||
| 2 spectra, LAAHPLNNR | 0.000 | 0.148 | 0.066 | 0.000 | 0.419 | 0.000 | 0.366 | 0.000 | ||
| 2 spectra, SSDDIDYR | 0.000 | 0.142 | 0.000 | 0.000 | 0.298 | 0.000 | 0.560 | 0.000 | ||
| 2 spectra, LLLSSR | 0.000 | 0.225 | 0.000 | 0.000 | 0.369 | 0.022 | 0.384 | 0.000 | ||
| 1 spectrum, AILSHLVK | 0.000 | 0.045 | 0.000 | 0.000 | 0.421 | 0.000 | 0.534 | 0.000 | ||
| 1 spectrum, VLPSAFNIPNR | 0.000 | 0.226 | 0.068 | 0.000 | 0.222 | 0.190 | 0.294 | 0.000 | ||
| 2 spectra, LTGHGLIHSFK | 0.000 | 0.194 | 0.121 | 0.000 | 0.251 | 0.142 | 0.292 | 0.000 | ||
| 1 spectrum, NLHNVK | 0.000 | 0.226 | 0.000 | 0.000 | 0.307 | 0.179 | 0.288 | 0.000 | ||
| 2 spectra, NAFSLLGK | 0.000 | 0.209 | 0.000 | 0.000 | 0.261 | 0.221 | 0.309 | 0.000 | ||
| 7 spectra, THPLLLR | 0.000 | 0.160 | 0.096 | 0.000 | 0.318 | 0.060 | 0.366 | 0.000 | ||
| 1 spectrum, HLVHLDWVSK | 0.000 | 0.375 | 0.000 | 0.000 | 0.102 | 0.327 | 0.196 | 0.000 | ||
| 1 spectrum, DATPPPVPAERPSYK | 0.000 | 0.244 | 0.000 | 0.000 | 0.320 | 0.064 | 0.372 | 0.000 | ||
| 1 spectrum, NLENWEQILQEK | 0.000 | 0.180 | 0.000 | 0.000 | 0.268 | 0.149 | 0.404 | 0.000 | ||
| 2 spectra, LVVKPR | 0.000 | 0.107 | 0.000 | 0.000 | 0.378 | 0.039 | 0.476 | 0.000 |
| Plot | Mito | Lyso or Perox | ER | Golgi | PM | Cytosol | Nucleus | ||||||
| Expt B |
5 peptides |
8 spectra |
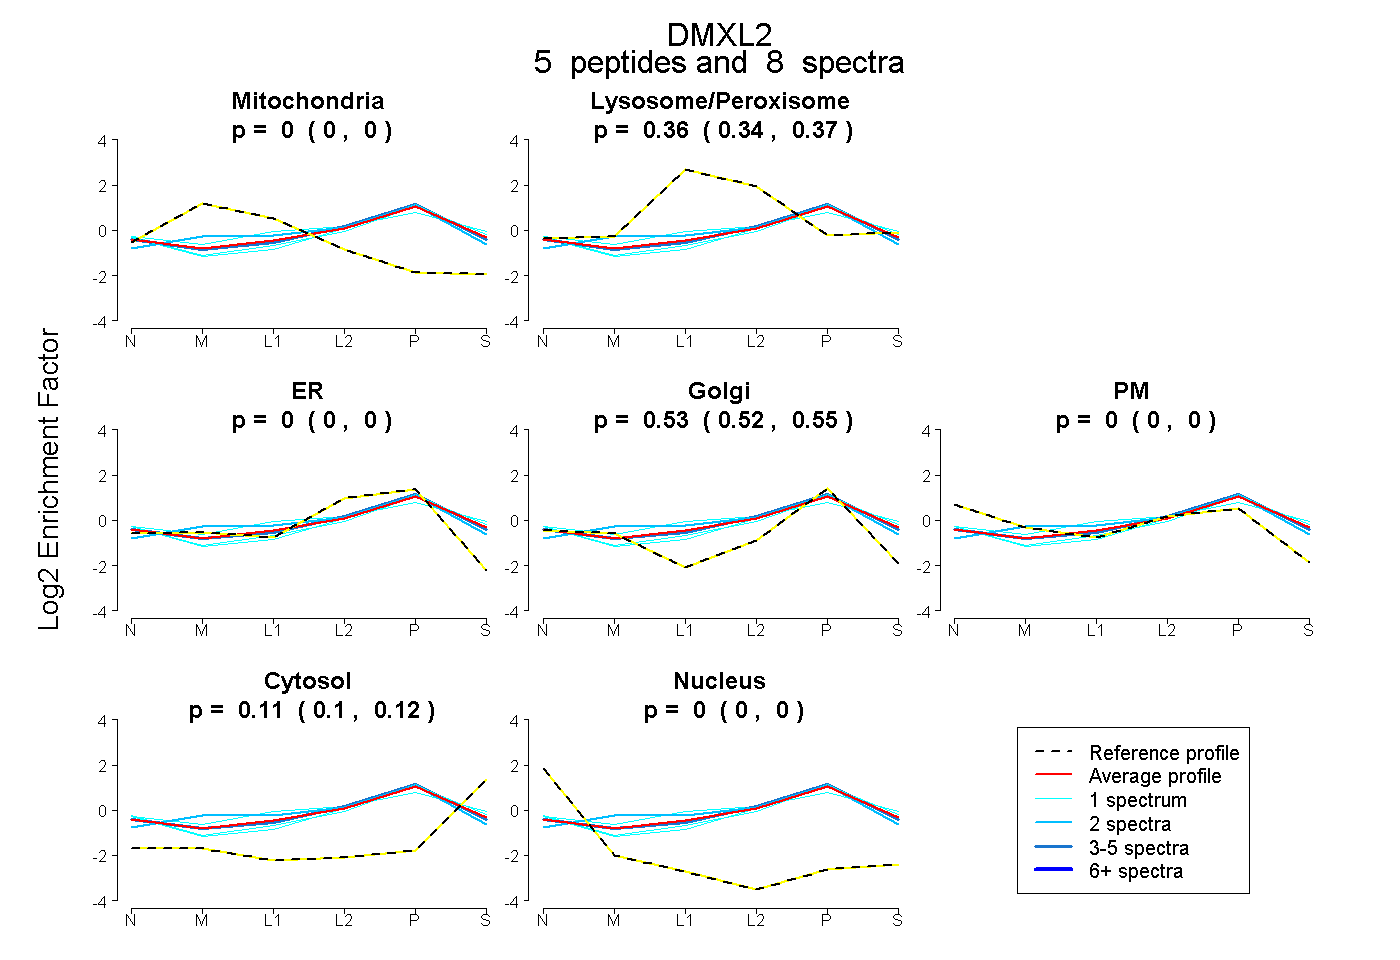 |
0.000 0.000 | 0.000 |
0.358 0.344 | 0.369 |
0.000 0.000 | 0.000 |
0.533 0.517 | 0.547 |
0.000 0.000 | 0.000 |
0.109 0.096 | 0.120 |
0.000 0.000 | 0.000 |
|||
| Plot | Lyso | Other | |||||||||||
| Expt C |
9 peptides |
16 spectra |
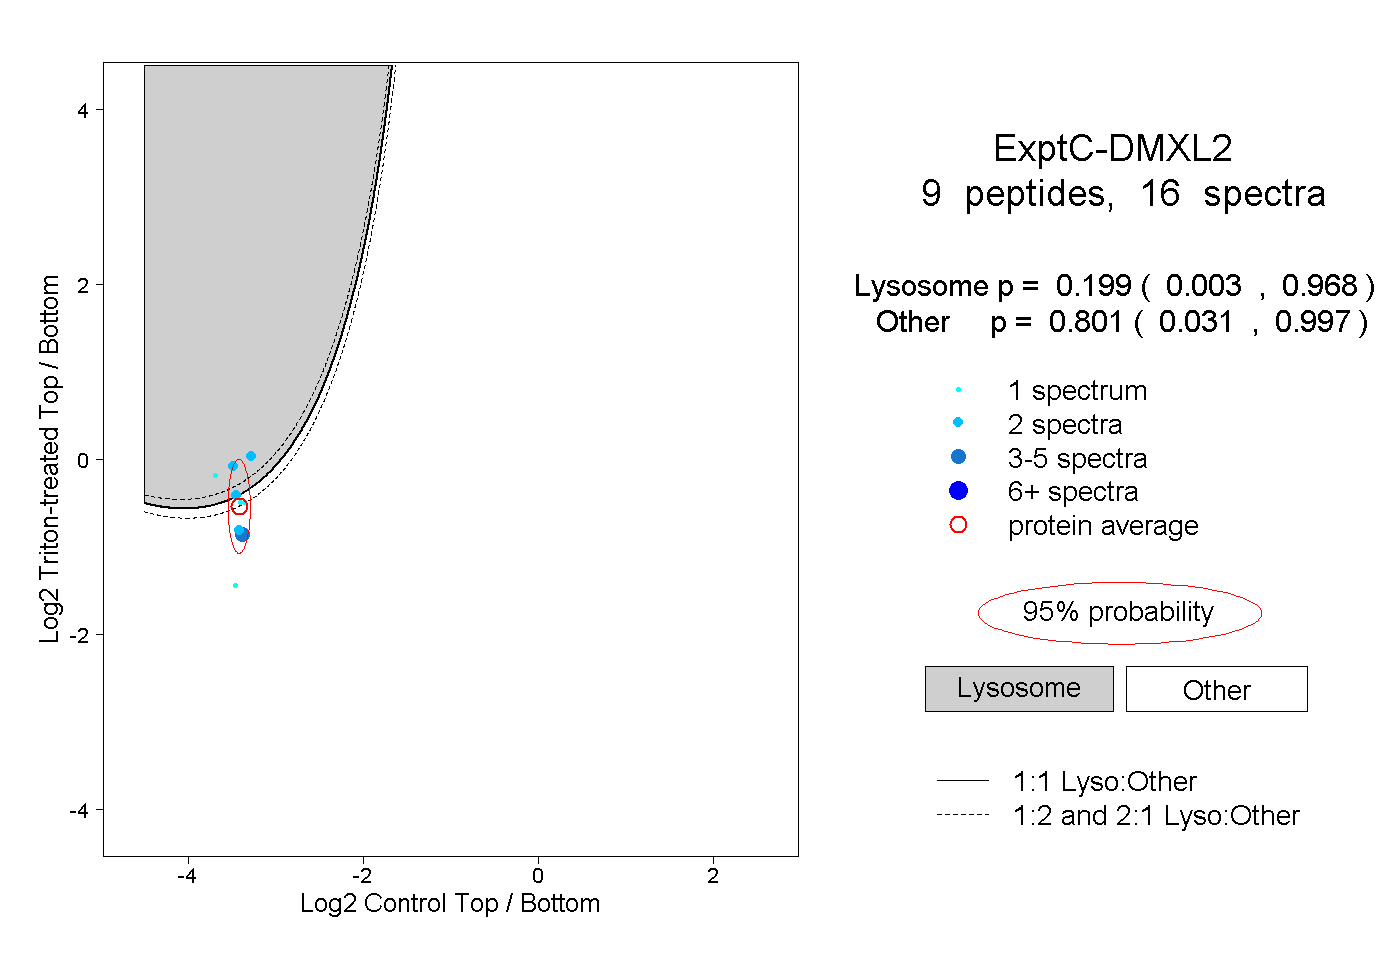 |
0.199 0.003 | 0.968 |
0.801 0.031 | 0.997 |
||||||||
| Plot | Lyso | Other | |||||||||||
| Expt D |
3 peptides |
5 spectra |
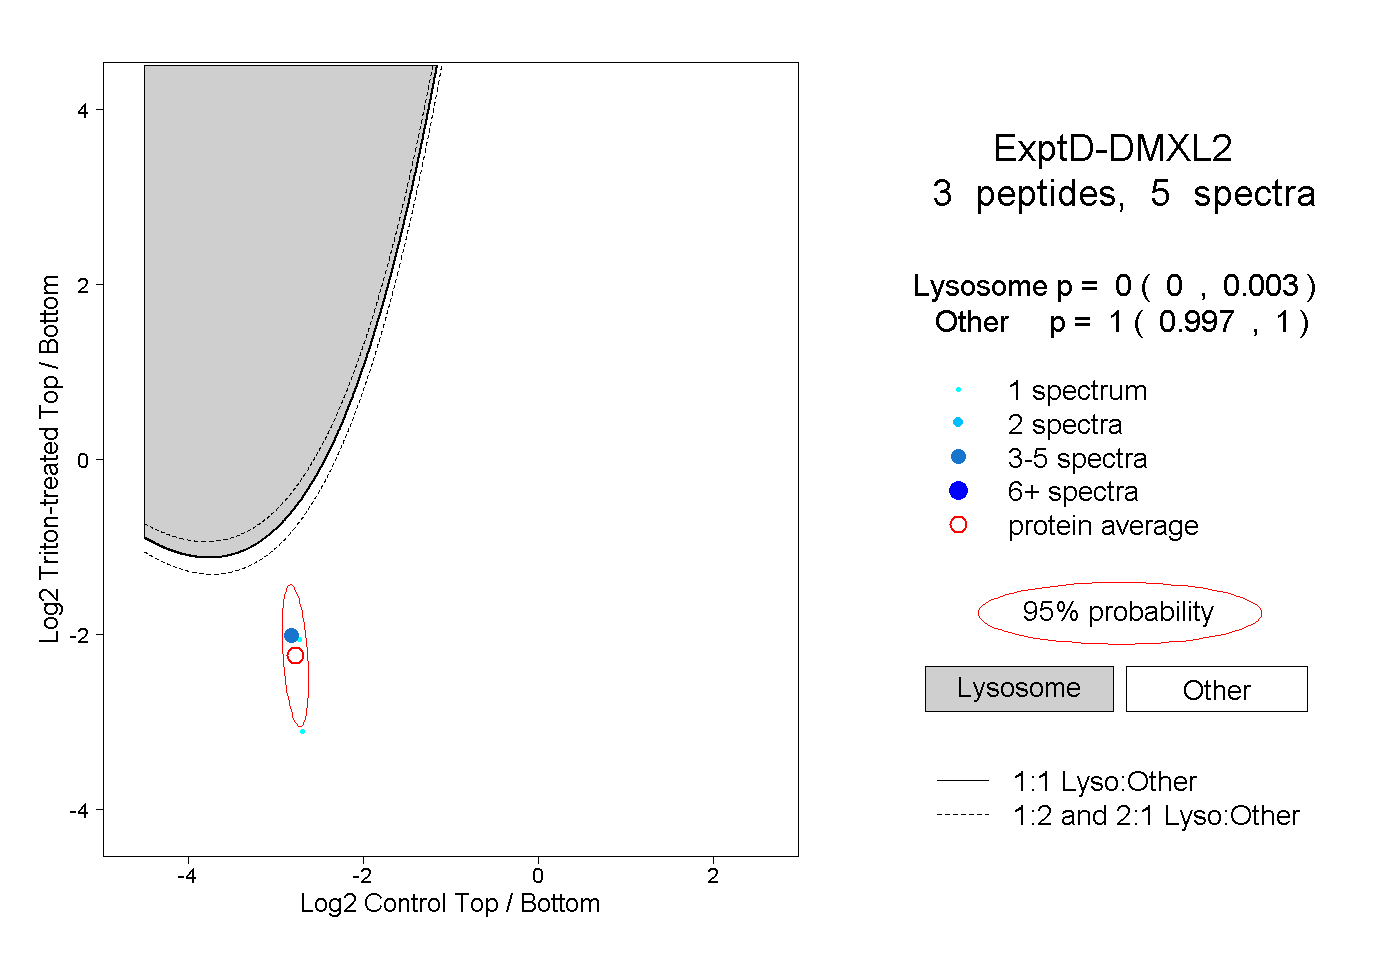 |
0.000 0.000 | 0.003 |
1.000 0.997 | 1.000 |