 8
8peptides
spectra
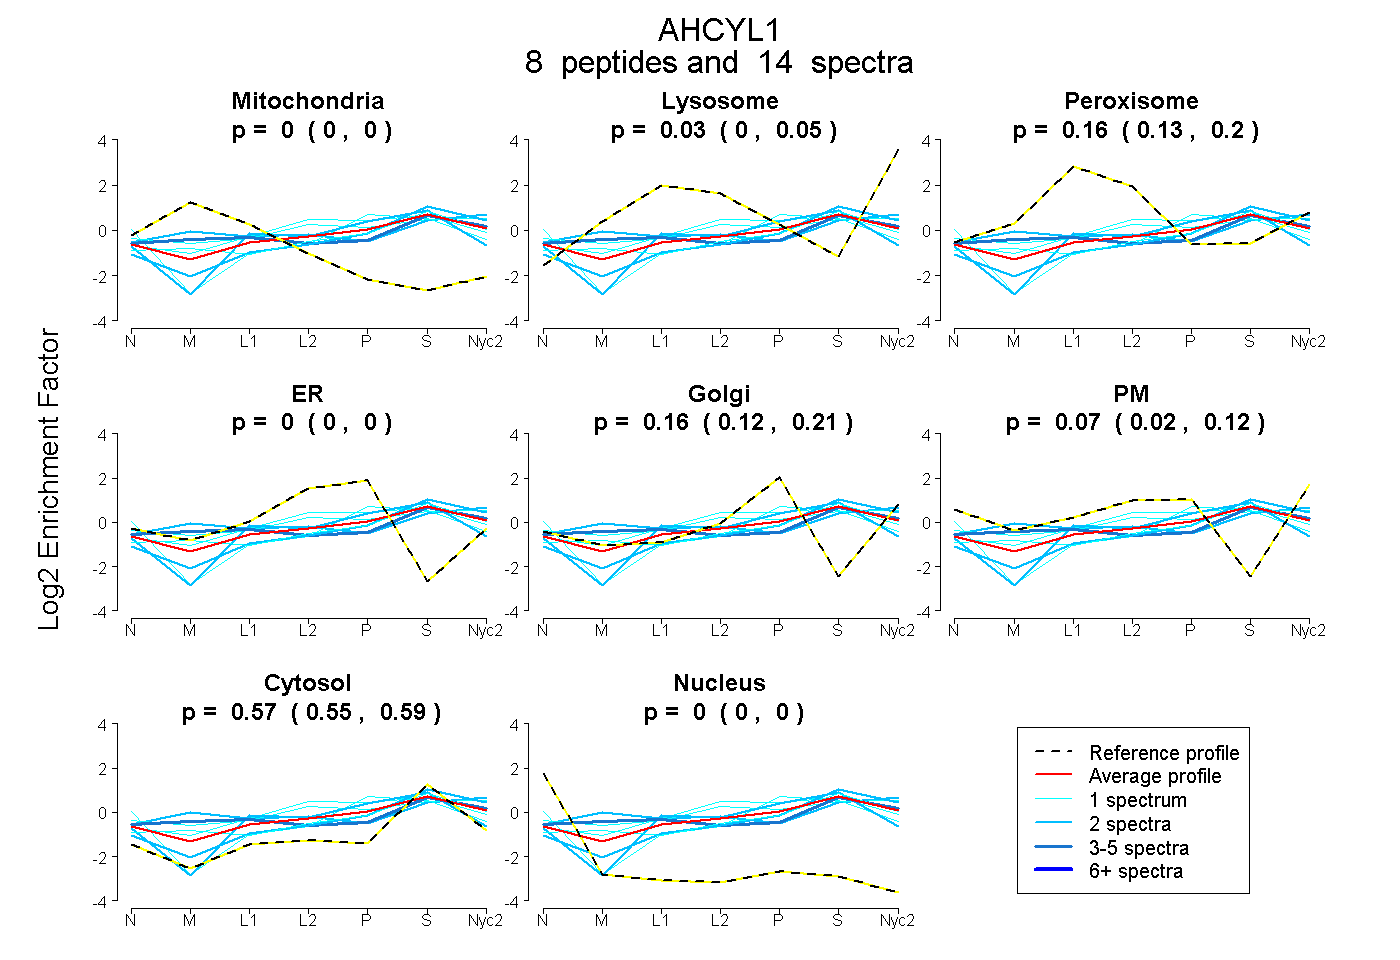
0.000 | 0.000
0.002 | 0.054
0.128 | 0.195
0.000 | 0.000
0.117 | 0.208
0.018 | 0.115
0.547 | 0.586
0.000 | 0.000
14peptides
spectra
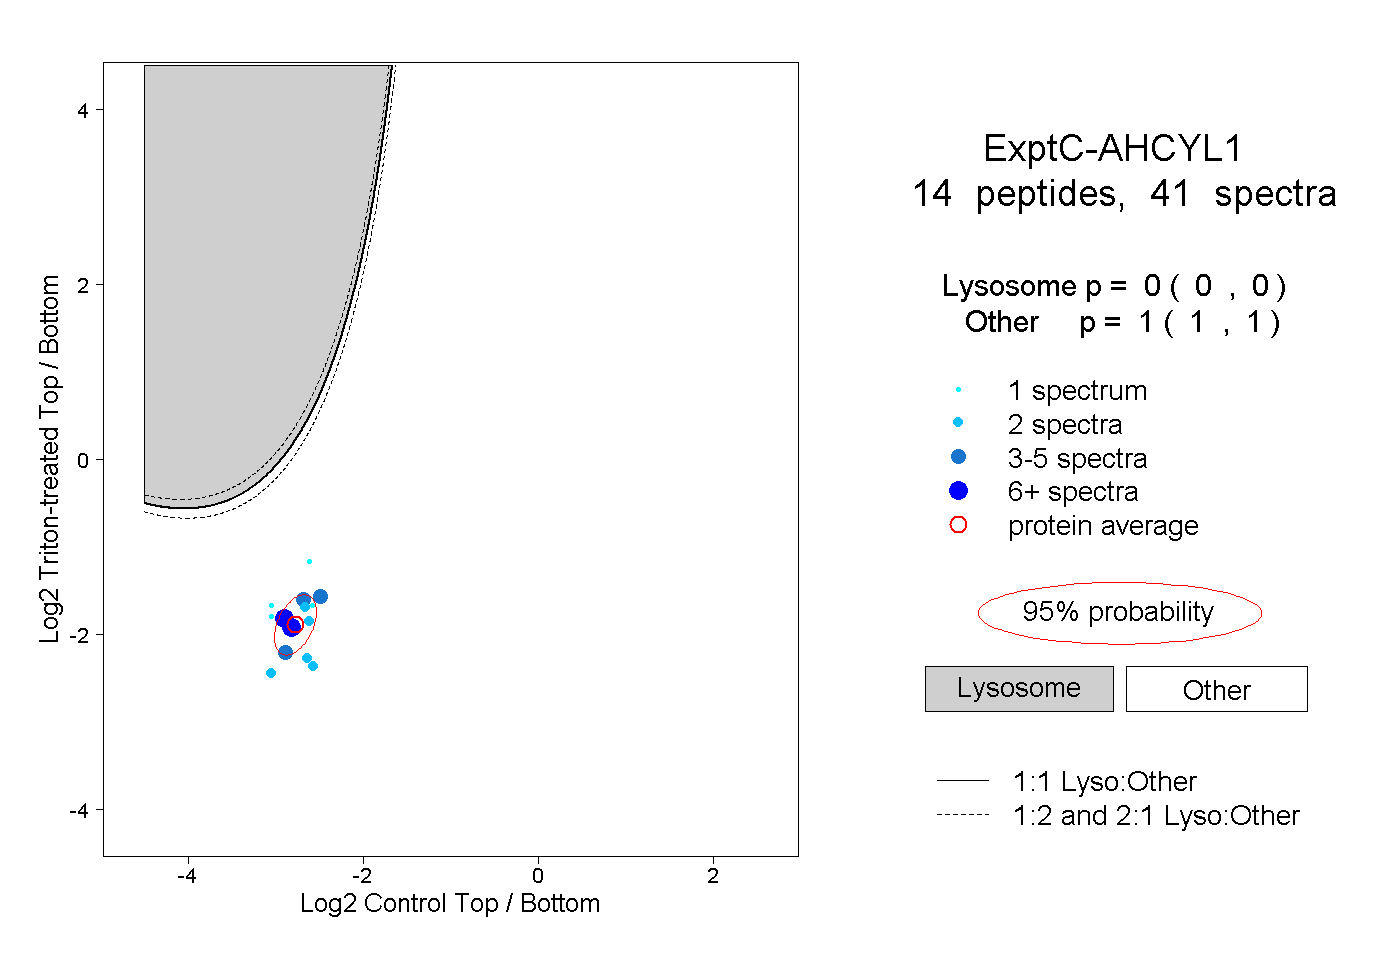
0.000 | 0.000
1.000 | 1.000
1peptide
spectrum
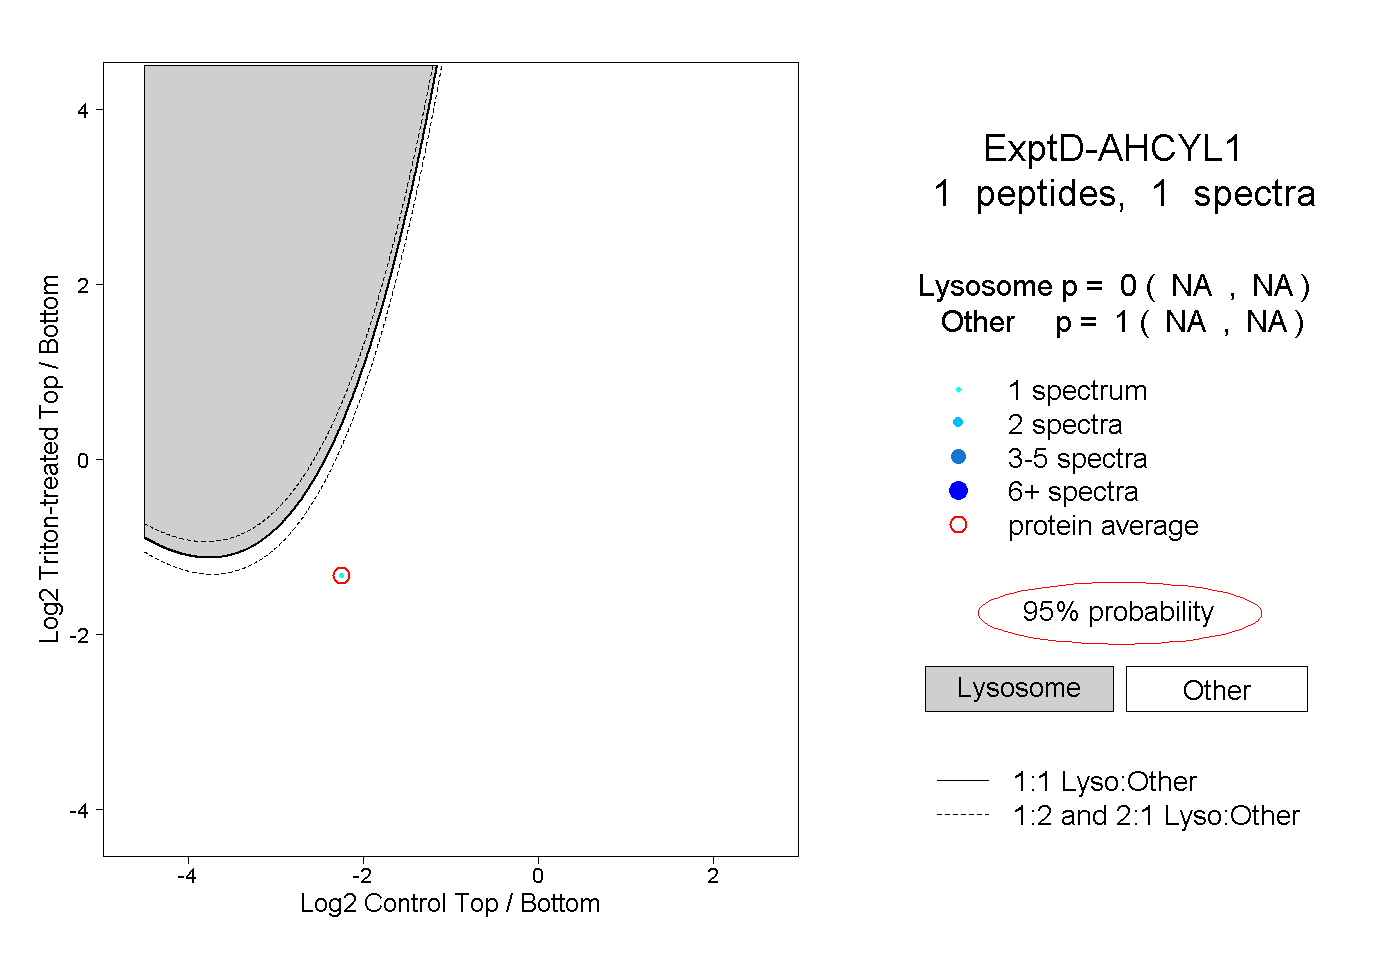
NA | NA
NA | NA