 8
8peptides
spectra
0.000 | 0.000
0.002 | 0.054
0.128 | 0.195
0.000 | 0.000
0.117 | 0.208
0.018 | 0.115
0.547 | 0.586
0.000 | 0.000
| Plot | Mito | Lyso | Perox | ER | Golgi | PM | Cytosol | Nucleus | |||||
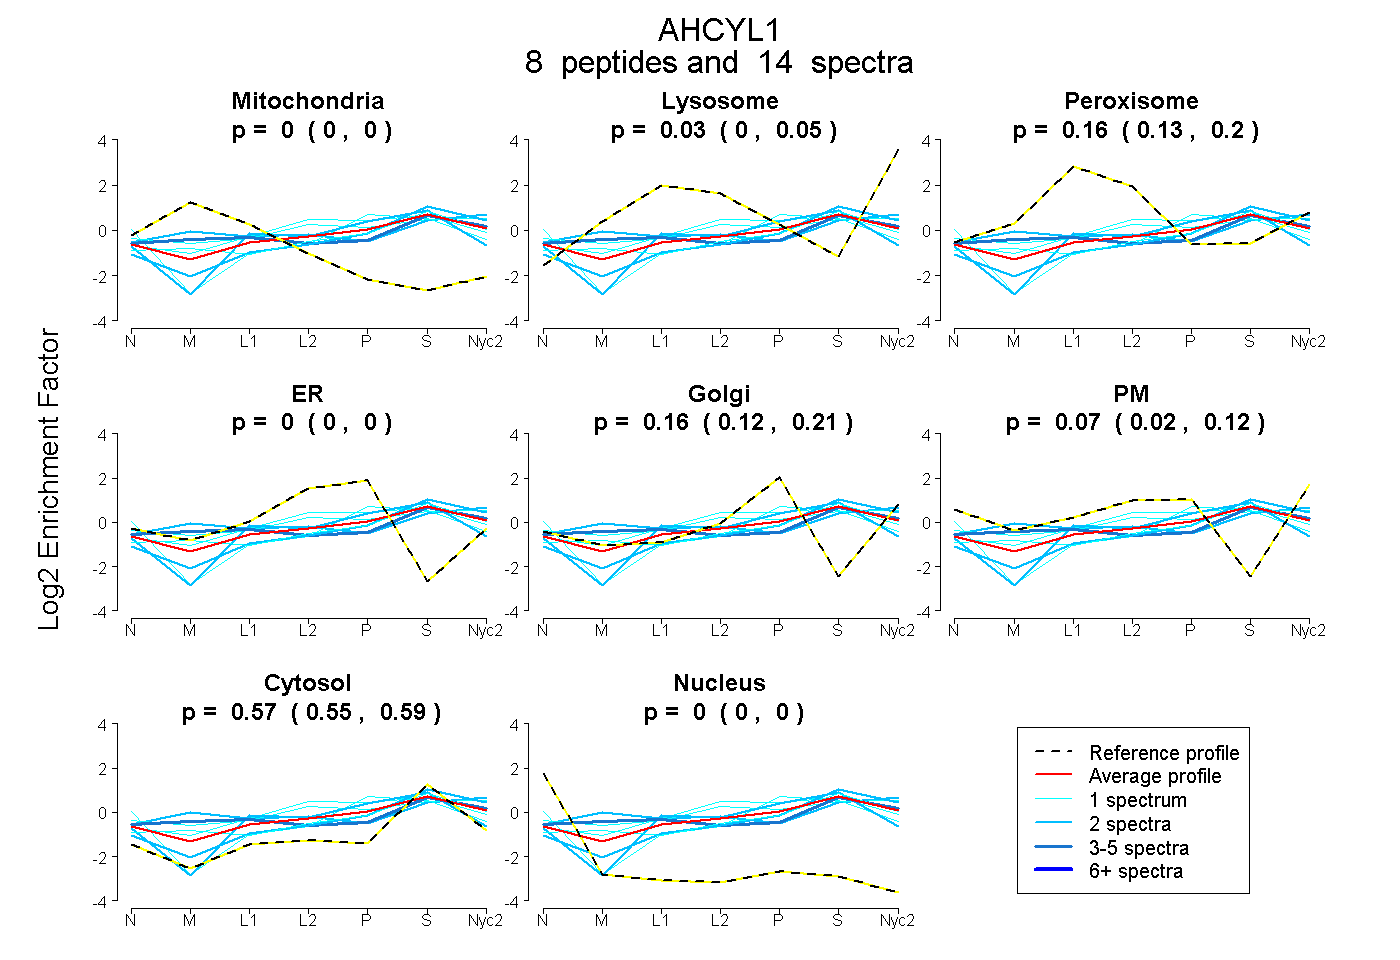
| Expt A |
8 peptides |
14 spectra |
|
0.000 0.000 | 0.000 |
0.031 0.002 | 0.054 |
0.163 0.128 | 0.195 |
0.000 0.000 | 0.000 |
0.165 0.117 | 0.208 |
0.073 0.018 | 0.115 |
0.569 0.547 | 0.586 |
0.000 0.000 | 0.000 |
| 2 spectra, VVLLAEGR | 0.000 | 0.161 | 0.000 | 0.000 | 0.128 | 0.000 | 0.711 | 0.000 | ||
| 1 spectrum, YPNVFK | 0.011 | 0.111 | 0.064 | 0.000 | 0.181 | 0.010 | 0.622 | 0.000 | ||
| 2 spectra, GIVEESVTGVHR | 0.118 | 0.269 | 0.047 | 0.000 | 0.000 | 0.114 | 0.451 | 0.000 | ||
| 2 spectra, QVVVCGYGEVGK | 0.000 | 0.000 | 0.066 | 0.253 | 0.000 | 0.000 | 0.681 | 0.000 | ||
| 1 spectrum, LCVPAMNVNDSVTK | 0.000 | 0.000 | 0.000 | 0.084 | 0.294 | 0.000 | 0.622 | 0.000 | ||
| 1 spectrum, GSSNFCVK | 0.000 | 0.056 | 0.183 | 0.260 | 0.008 | 0.000 | 0.492 | 0.000 | ||
| 1 spectrum, QAEFGR | 0.000 | 0.081 | 0.145 | 0.000 | 0.001 | 0.305 | 0.468 | 0.000 | ||
| 4 spectra, TPELTWER | 0.091 | 0.130 | 0.114 | 0.000 | 0.000 | 0.121 | 0.545 | 0.000 |
| Plot | Lyso | Other | |||||||||||
| Expt C |
14 peptides |
41 spectra |
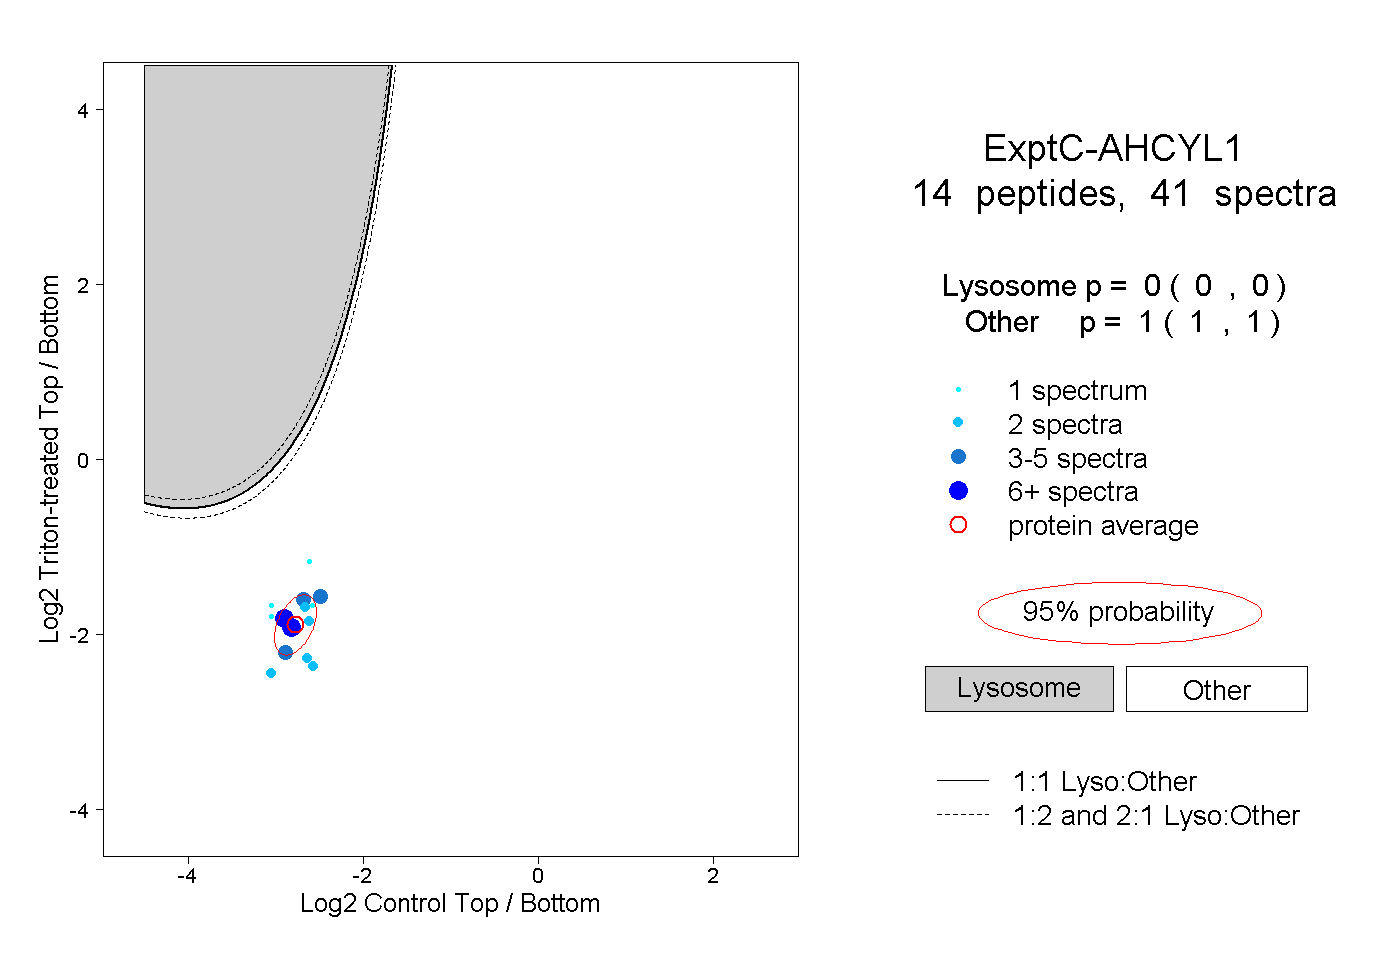 |
0.000 0.000 | 0.000 |
1.000 1.000 | 1.000 |
||||||||
| Plot | Lyso | Other | |||||||||||
| Expt D |
1 peptide |
1 spectrum |
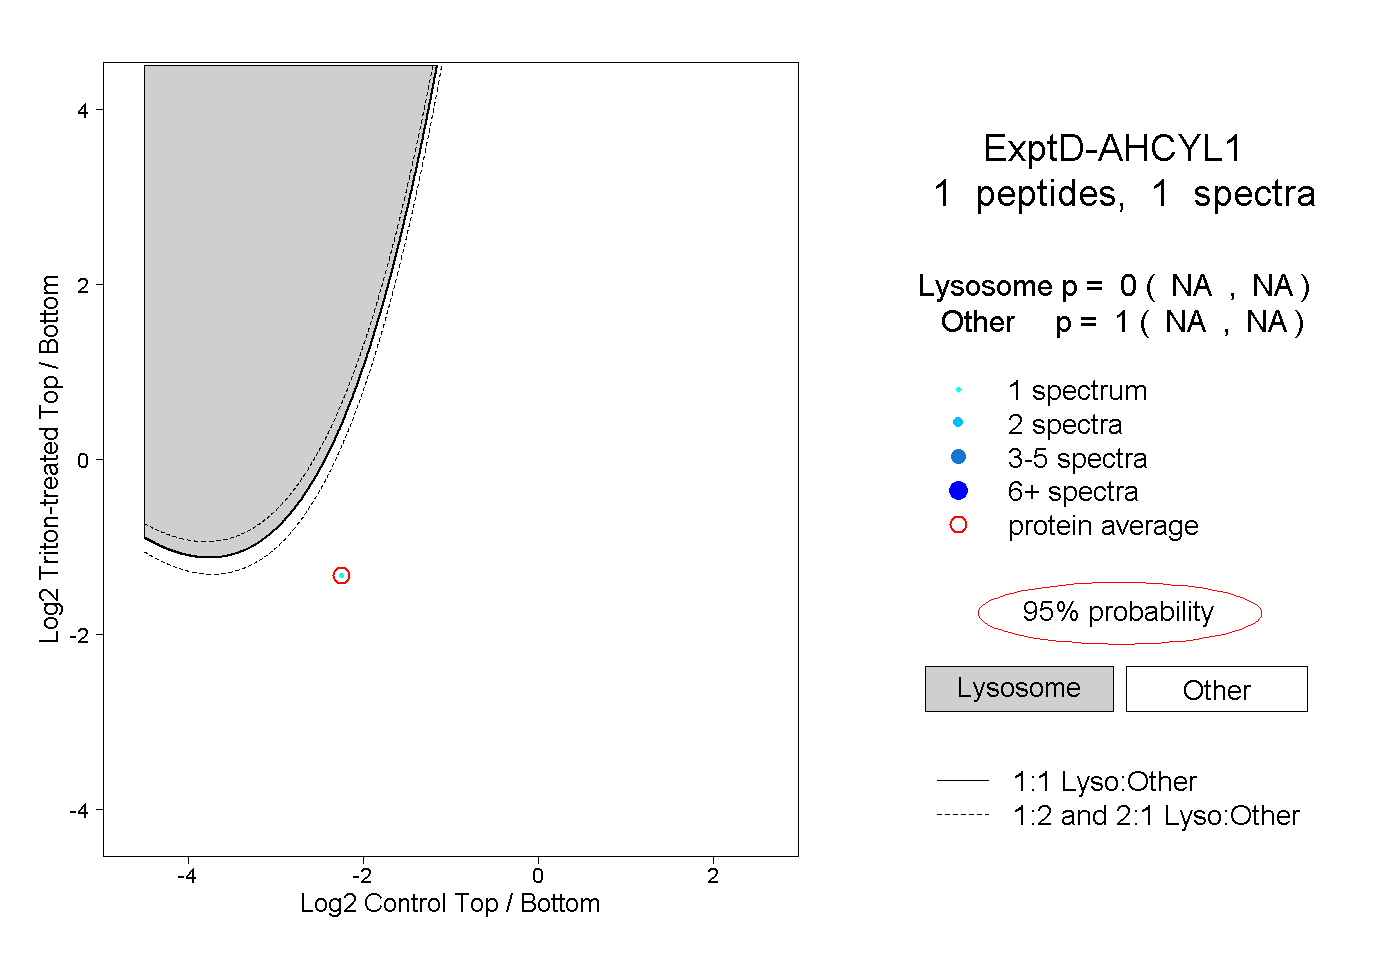 |
0.000 NA | NA |
1.000 NA | NA |