 10
10peptides
spectra
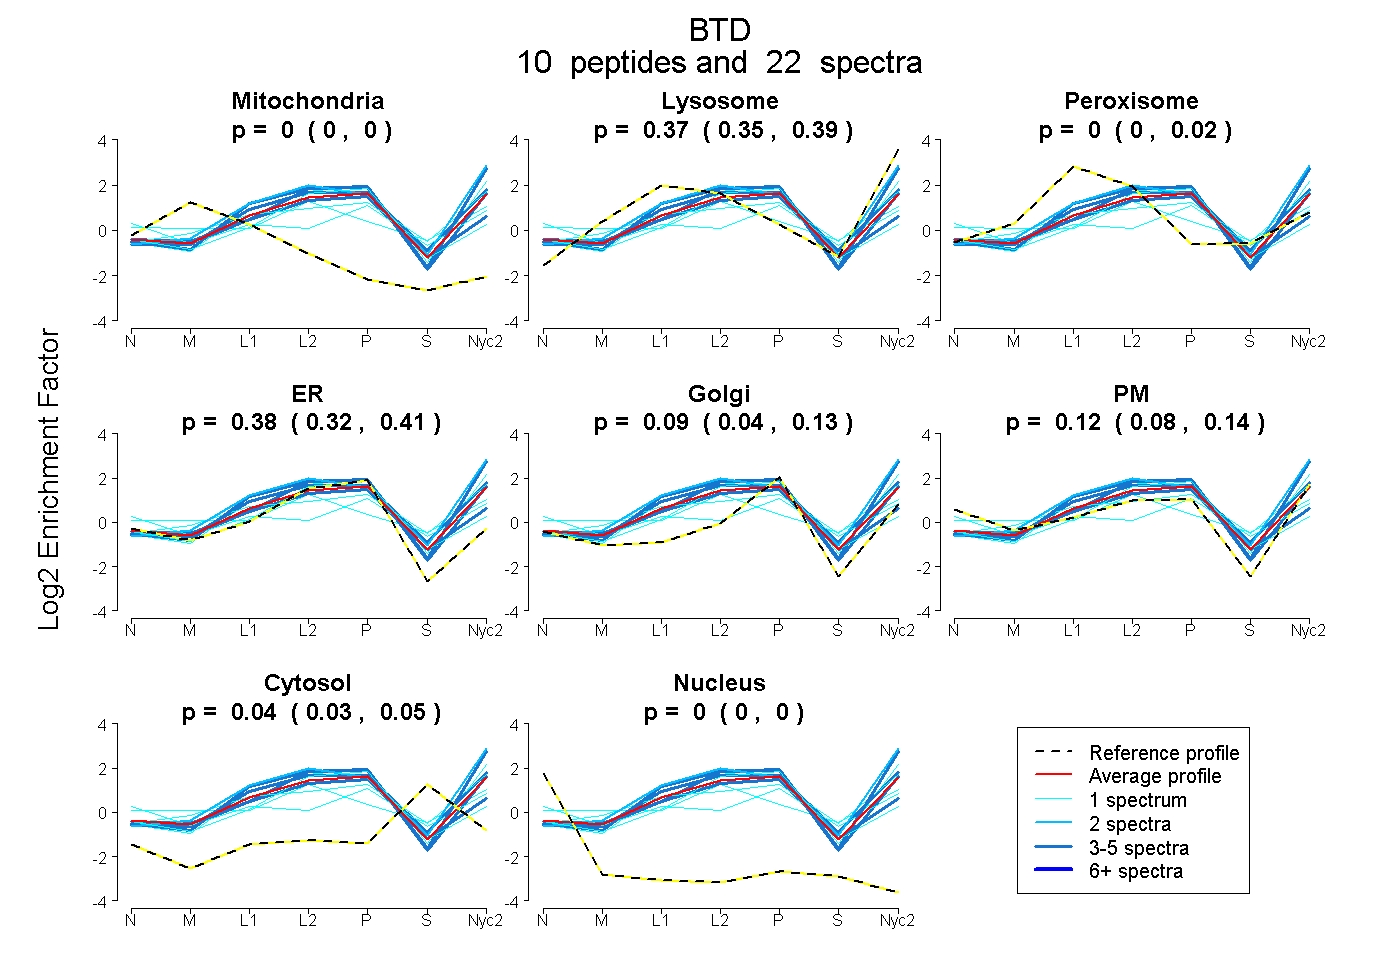
0.000 | 0.000
0.346 | 0.387
0.000 | 0.025
0.323 | 0.414
0.045 | 0.134
0.079 | 0.144
0.032 | 0.053
0.000 | 0.000
2peptides
spectra
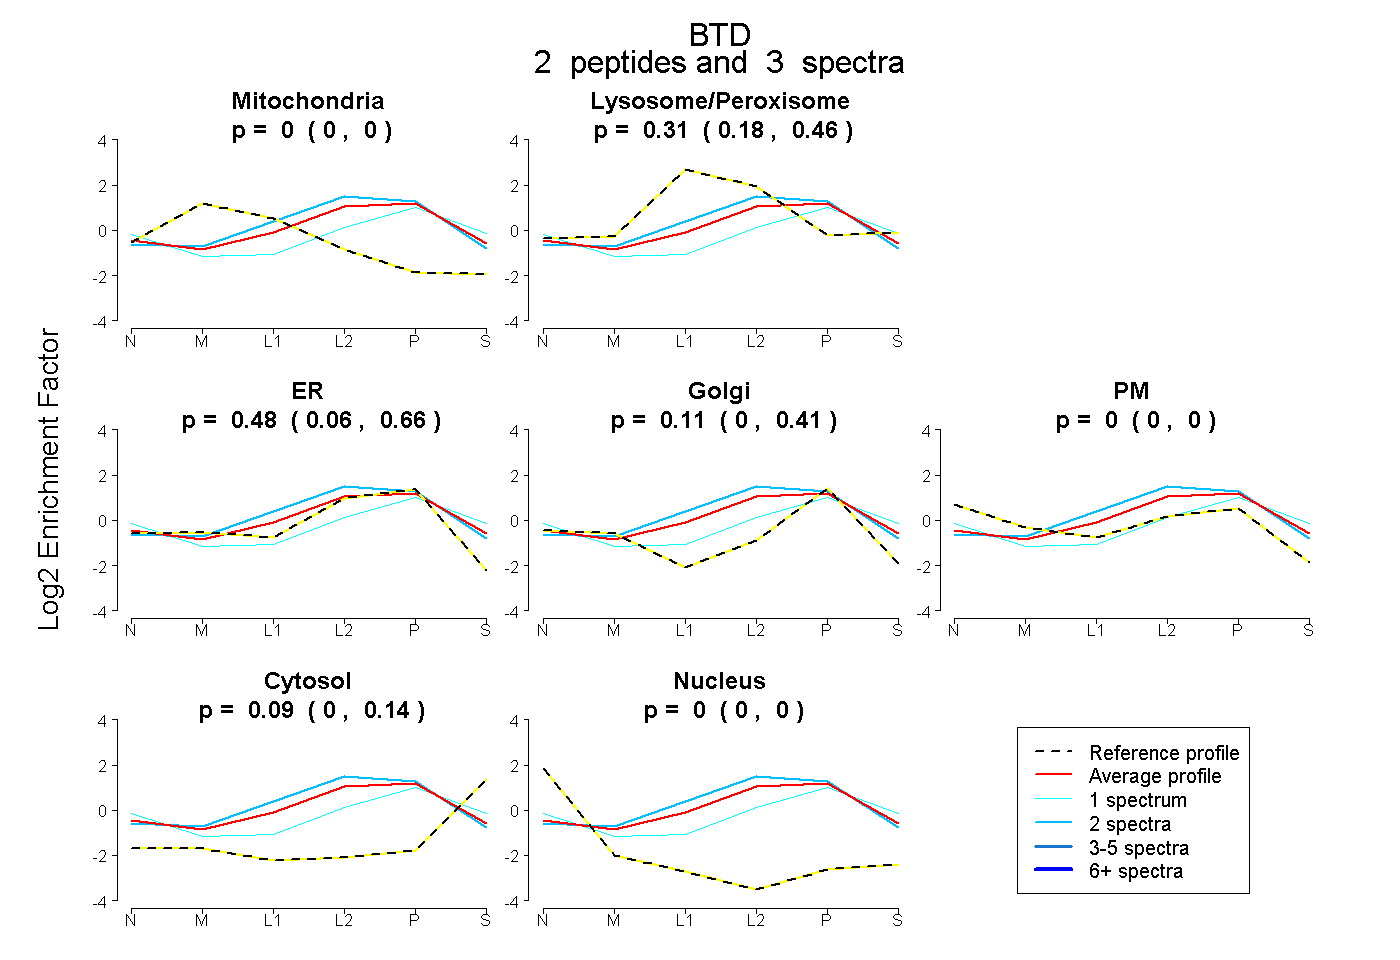
0.000 | 0.000
0.183 | 0.465
0.060 | 0.661
0.000 | 0.410
0.000 | 0.000
0.000 | 0.143
0.000 | 0.000
10peptides
spectra
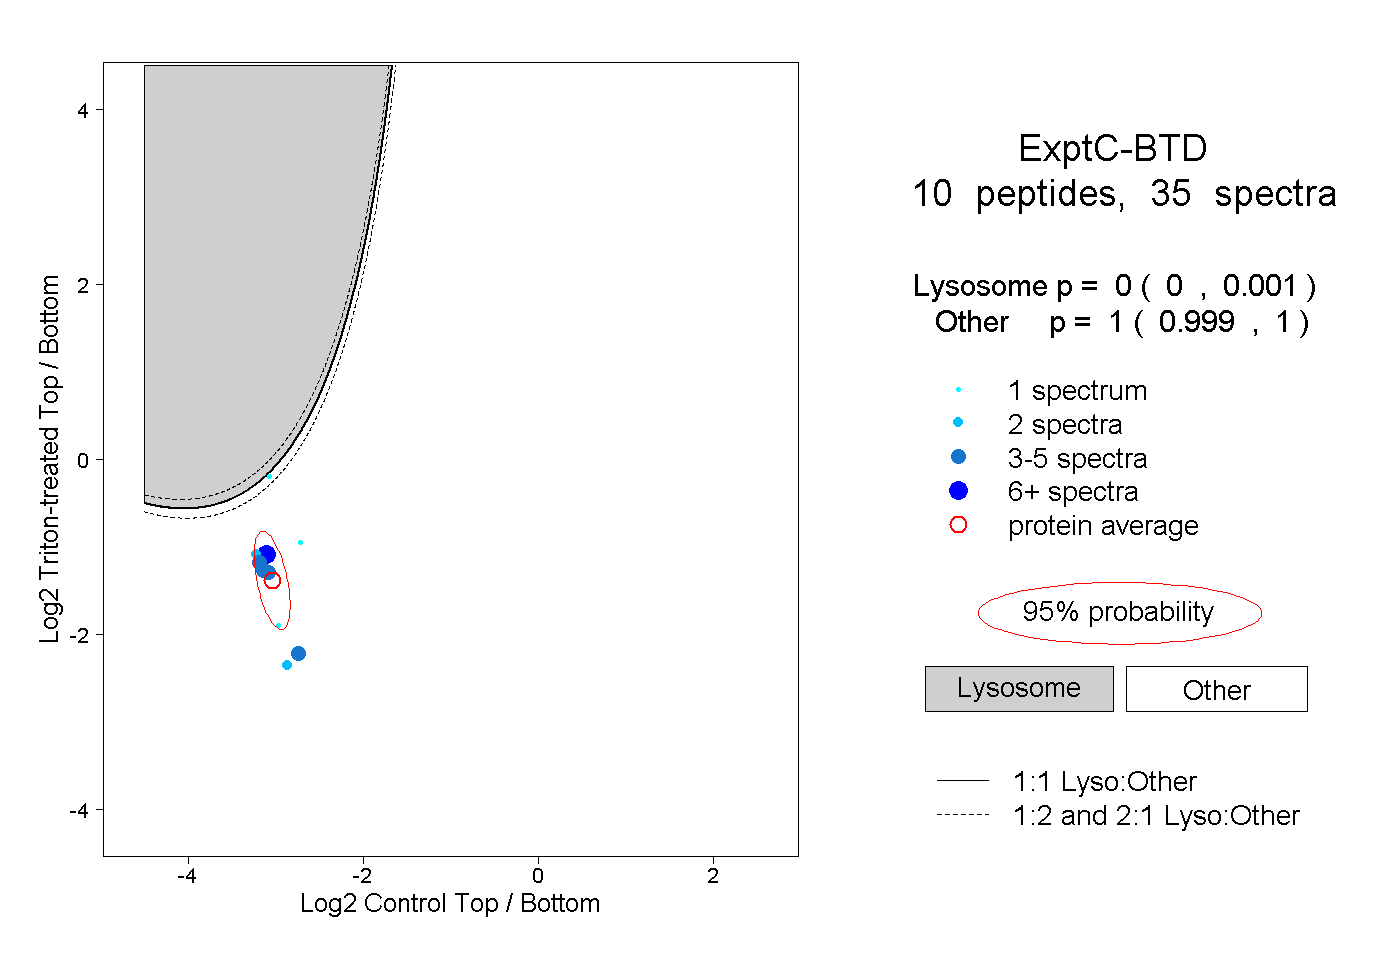
0.000 | 0.001
0.999 | 1.000
1peptide
spectrum
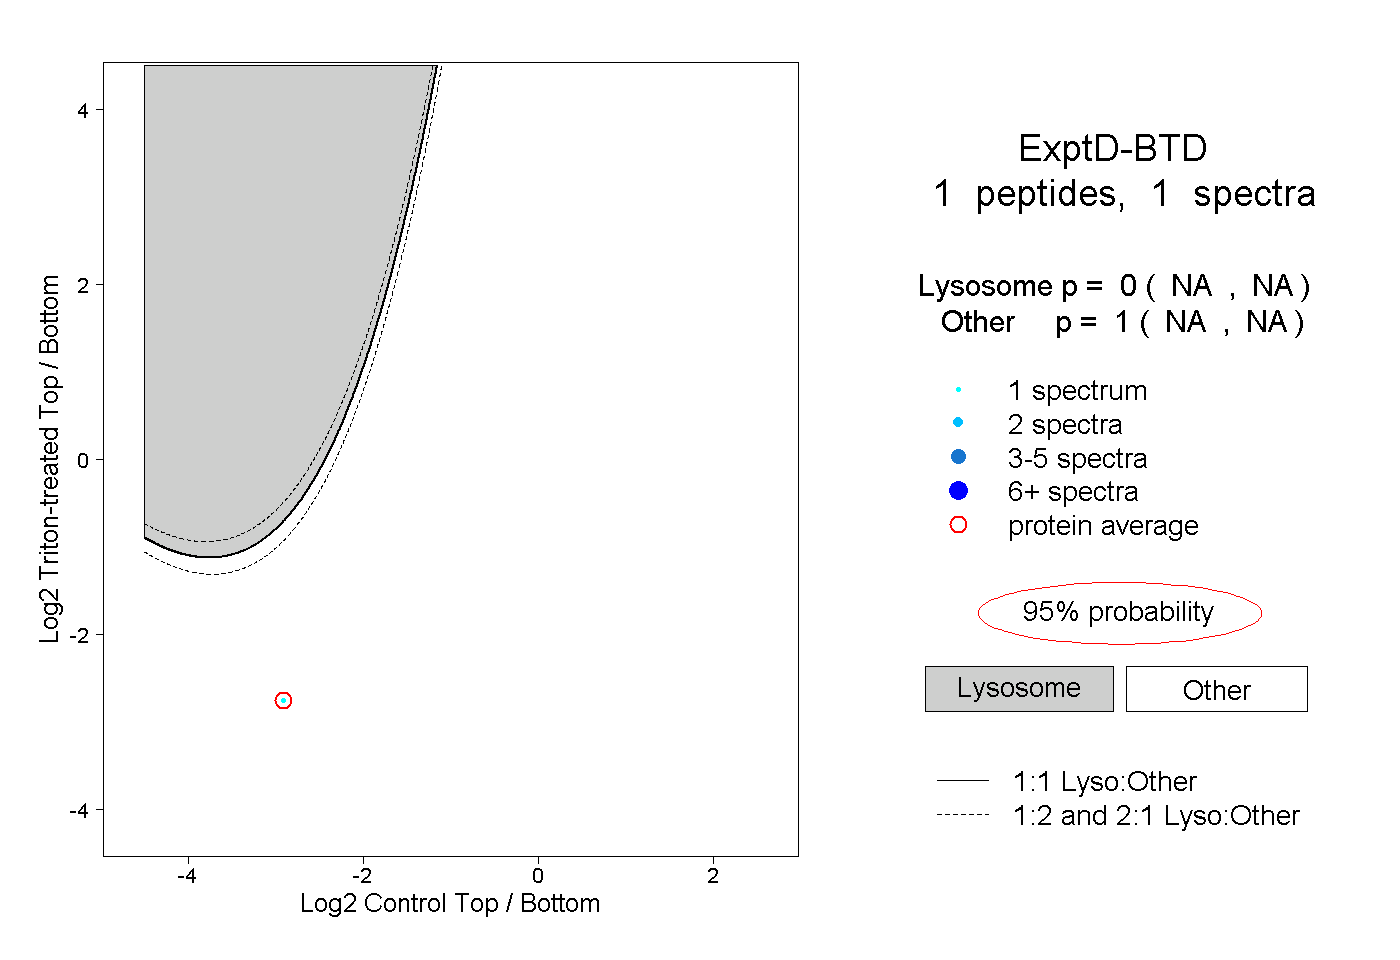
NA | NA
NA | NA