 10
10peptides
spectra
0.000 | 0.000
0.346 | 0.387
0.000 | 0.025
0.323 | 0.414
0.045 | 0.134
0.079 | 0.144
0.032 | 0.053
0.000 | 0.000
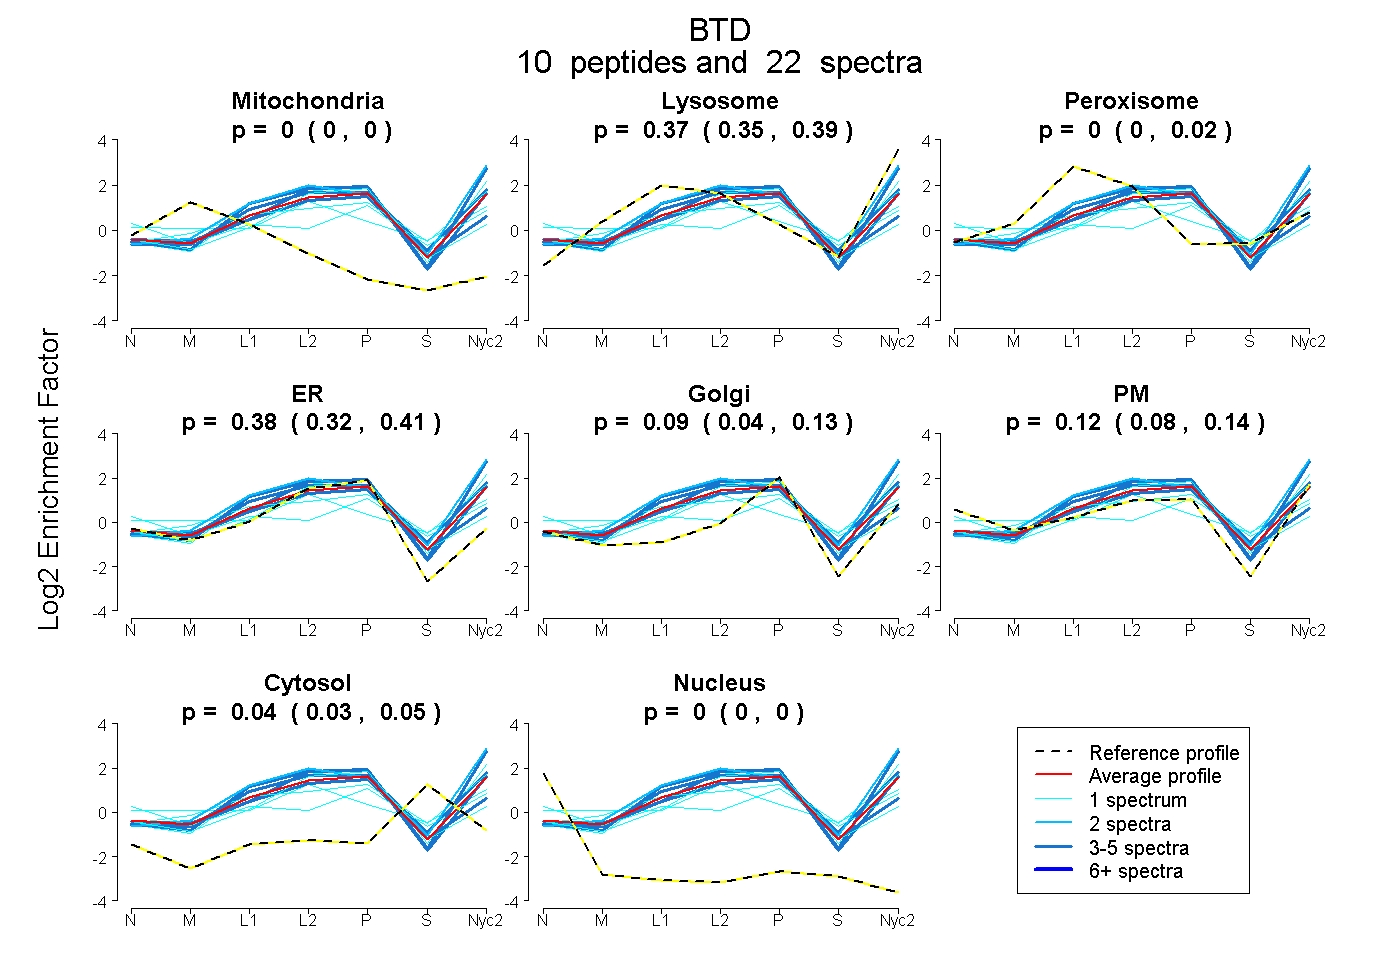
| Plot | Mito | Lyso | Perox | ER | Golgi | PM | Cytosol | Nucleus | |||||
| Expt A |
10 peptides |
22 spectra |
|
0.000 0.000 | 0.000 |
0.373 0.346 | 0.387 |
0.000 0.000 | 0.025 |
0.376 0.323 | 0.414 |
0.089 0.045 | 0.134 |
0.118 0.079 | 0.144 |
0.045 0.032 | 0.053 |
0.000 0.000 | 0.000 |
| 2 spectra, TSIYPFLDLMPSPR | 0.000 | 0.642 | 0.000 | 0.193 | 0.029 | 0.137 | 0.000 | 0.000 | ||
| 4 spectra, SVLSPNPLELSSR | 0.000 | 0.516 | 0.000 | 0.218 | 0.077 | 0.189 | 0.000 | 0.000 | ||
| 1 spectrum, VLSGDPYCEK | 0.000 | 0.137 | 0.015 | 0.738 | 0.000 | 0.000 | 0.110 | 0.000 | ||
| 1 spectrum, QNLDVYEQQVMAAAQK | 0.000 | 0.349 | 0.203 | 0.000 | 0.375 | 0.000 | 0.073 | 0.000 | ||
| 1 spectrum, GLSSGLVTAALYGR | 0.000 | 0.474 | 0.000 | 0.335 | 0.180 | 0.010 | 0.000 | 0.000 | ||
| 1 spectrum, QQALELMK | 0.000 | 0.000 | 0.189 | 0.000 | 0.259 | 0.357 | 0.195 | 0.000 | ||
| 3 spectra, MFLVANLGTK | 0.000 | 0.495 | 0.000 | 0.408 | 0.047 | 0.000 | 0.050 | 0.000 | ||
| 5 spectra, LSCMAIK | 0.000 | 0.134 | 0.182 | 0.447 | 0.171 | 0.000 | 0.066 | 0.000 | ||
| 1 spectrum, CDEAAK | 0.000 | 0.032 | 0.268 | 0.000 | 0.000 | 0.507 | 0.193 | 0.000 | ||
| 3 spectra, LVSWNPCLEPFR | 0.000 | 0.368 | 0.000 | 0.506 | 0.097 | 0.030 | 0.000 | 0.000 |
| Plot | Mito | Lyso or Perox | ER | Golgi | PM | Cytosol | Nucleus | ||||||
| Expt B |
2 peptides |
3 spectra |
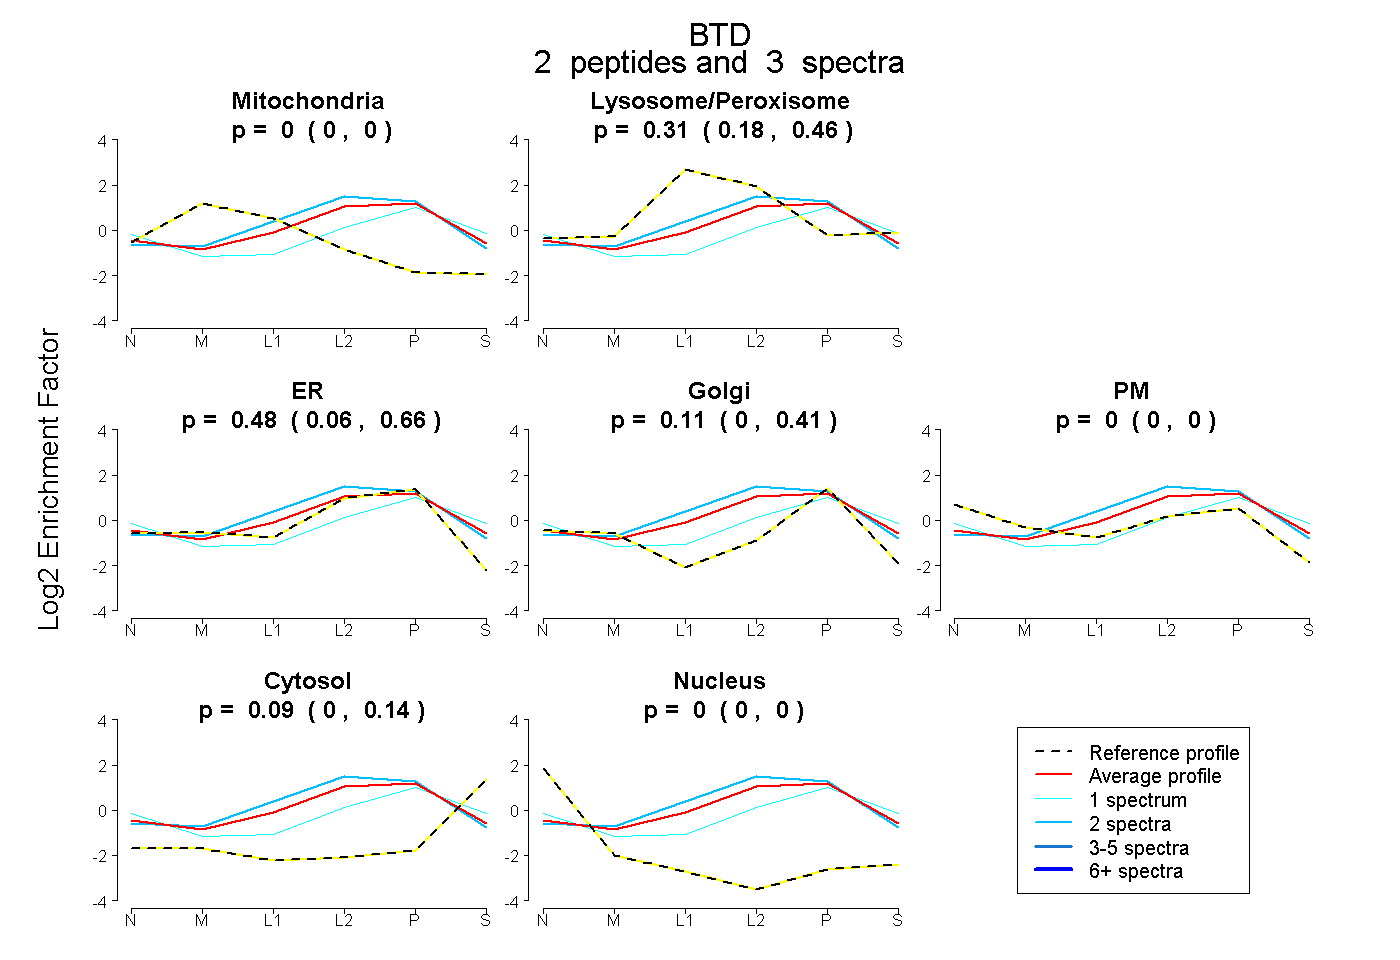 |
0.000 0.000 | 0.000 |
0.314 0.183 | 0.465 |
0.484 0.060 | 0.661 |
0.107 0.000 | 0.410 |
0.000 0.000 | 0.000 |
0.094 0.000 | 0.143 |
0.000 0.000 | 0.000 |
|||
| Plot | Lyso | Other | |||||||||||
| Expt C |
10 peptides |
35 spectra |
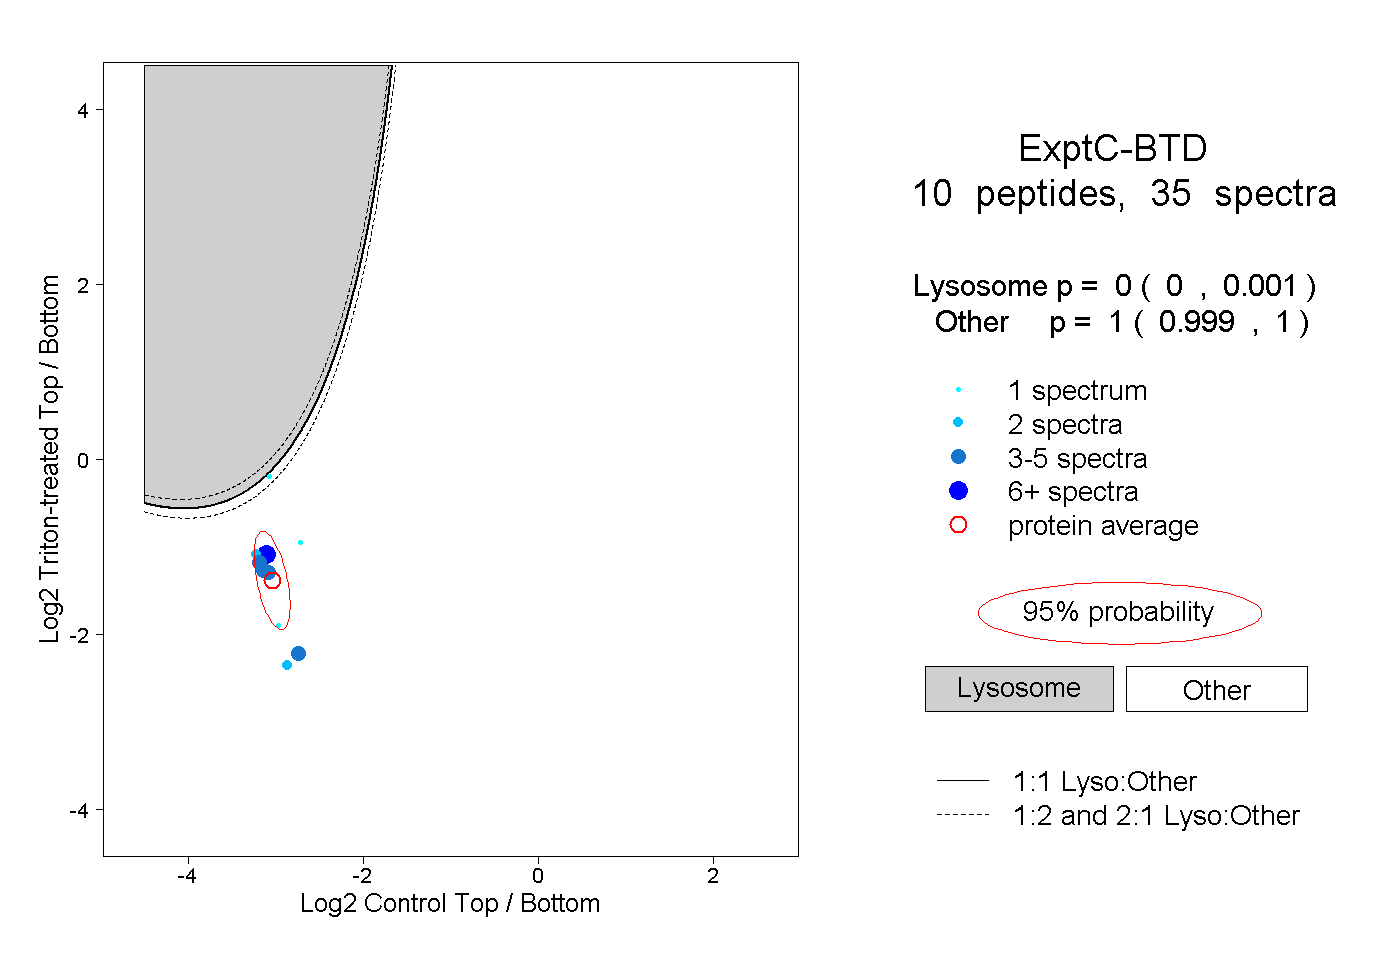 |
0.000 0.000 | 0.001 |
1.000 0.999 | 1.000 |
||||||||
| Plot | Lyso | Other | |||||||||||
| Expt D |
1 peptide |
1 spectrum |
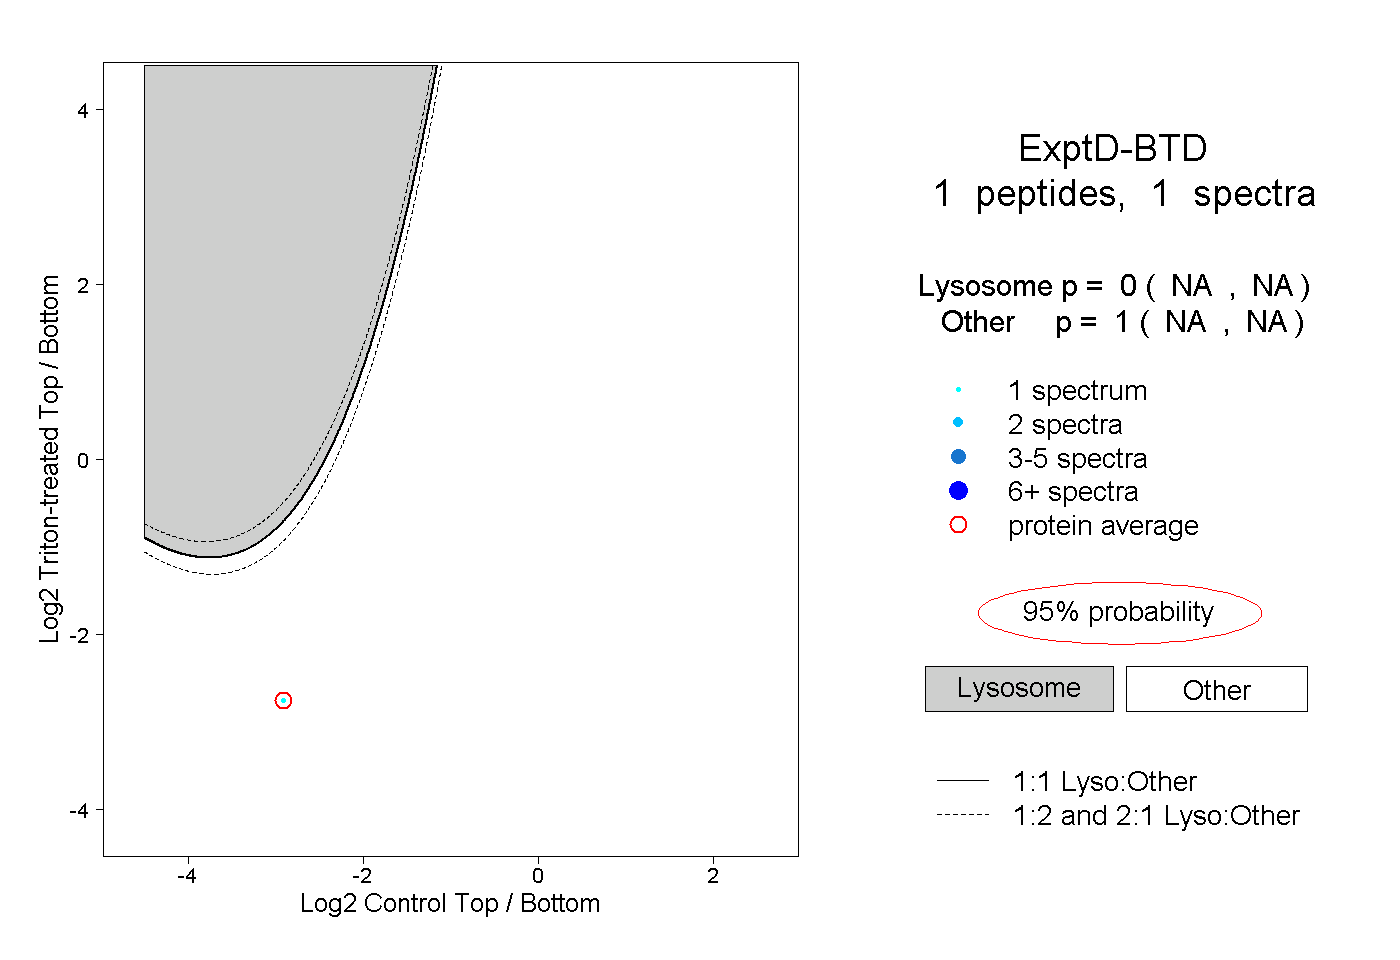 |
0.000 NA | NA |
1.000 NA | NA |