 5
5peptides
spectra
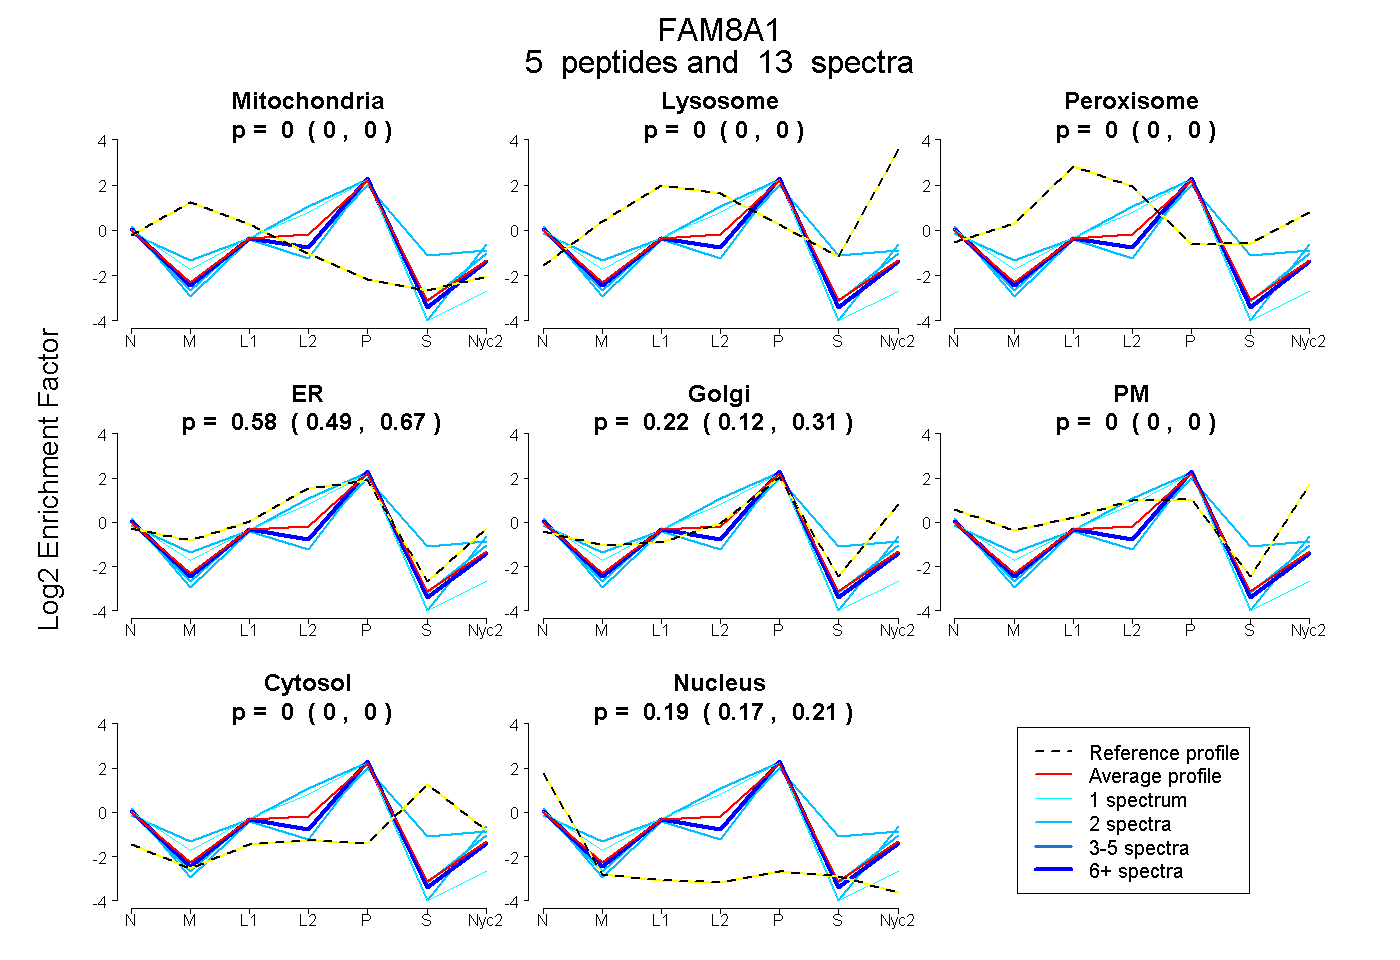
0.000 | 0.000
0.000 | 0.000
0.000 | 0.000
0.492 | 0.667
0.120 | 0.305
0.000 | 0.000
0.000 | 0.000
0.172 | 0.205
3peptides
spectra

0.000 | 0.080
0.000 | 0.131
0.120 | 0.521
0.319 | 0.727
0.000 | 0.138
0.000 | 0.002
0.000 | 0.066
3peptides
spectra
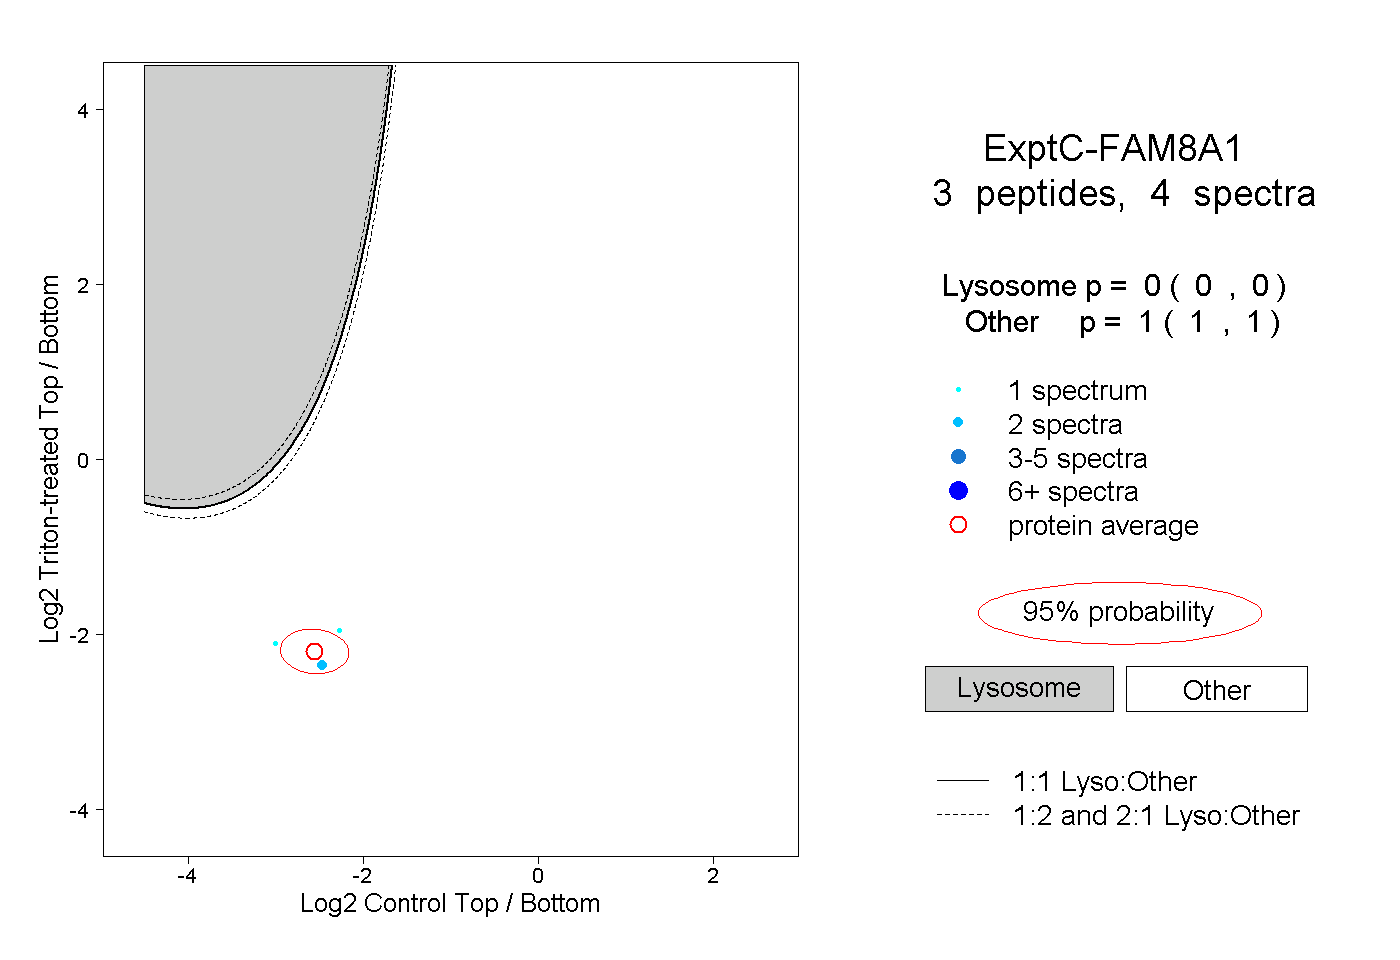
0.000 | 0.000
1.000 | 1.000