 5
5peptides
spectra
0.000 | 0.000
0.000 | 0.000
0.000 | 0.000
0.492 | 0.667
0.120 | 0.305
0.000 | 0.000
0.000 | 0.000
0.172 | 0.205
| Plot | Mito | Lyso | Perox | ER | Golgi | PM | Cytosol | Nucleus | |||||
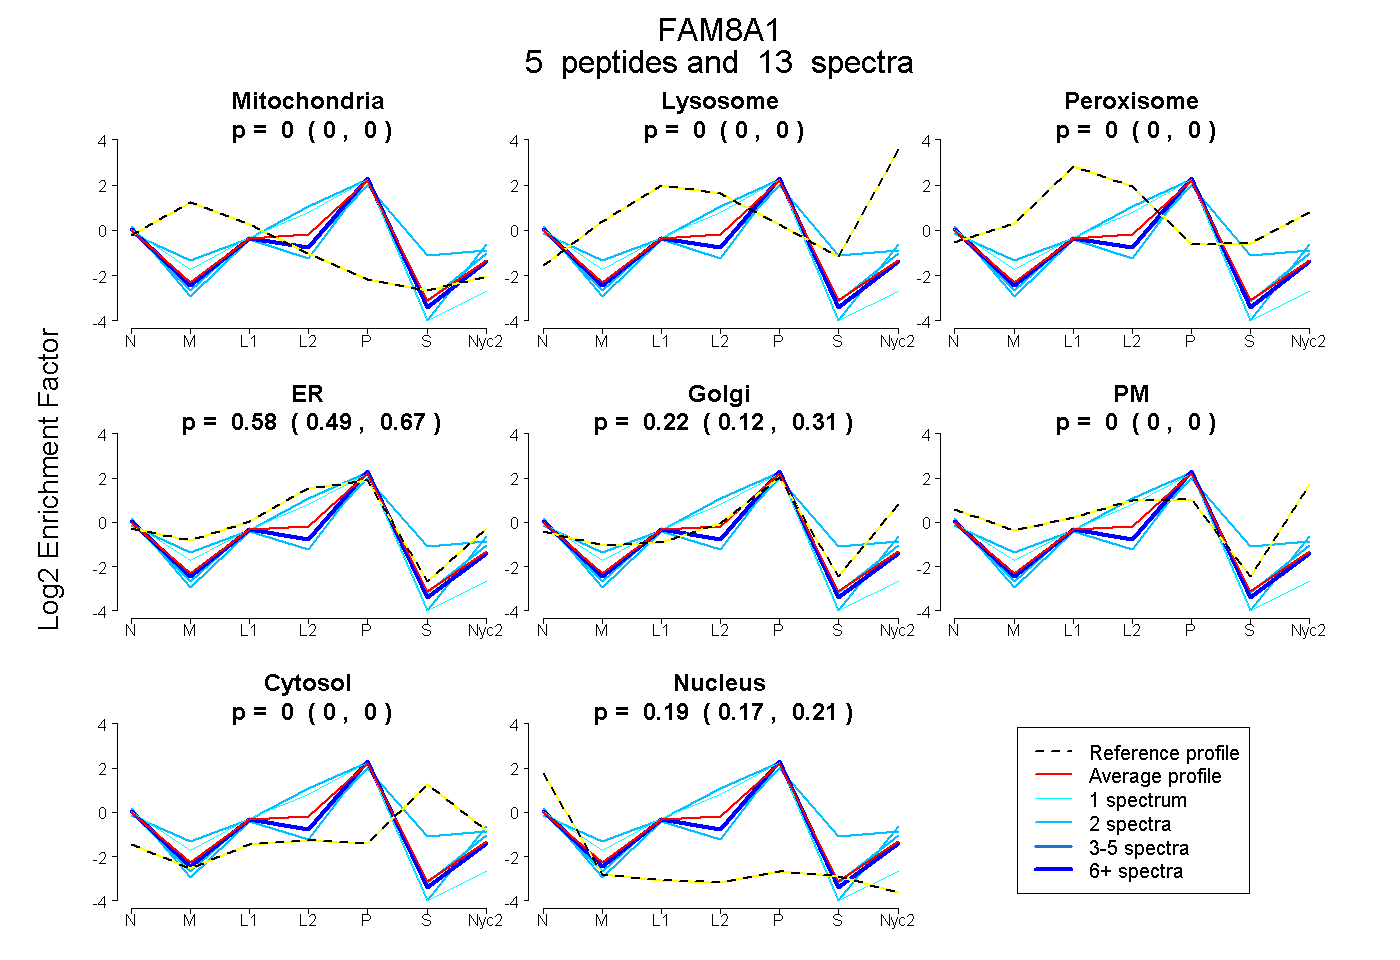
| Expt A |
5 peptides |
13 spectra |
|
0.000 0.000 | 0.000 |
0.000 0.000 | 0.000 |
0.000 0.000 | 0.000 |
0.585 0.492 | 0.667 |
0.224 0.120 | 0.305 |
0.000 0.000 | 0.000 |
0.000 0.000 | 0.000 |
0.191 0.172 | 0.205 |
| 6 spectra, VGSAAPAR | 0.000 | 0.000 | 0.000 | 0.428 | 0.351 | 0.000 | 0.000 | 0.221 | ||
| 2 spectra, FLLGLR | 0.000 | 0.000 | 0.000 | 0.901 | 0.035 | 0.000 | 0.000 | 0.064 | ||
| 1 spectrum, VVTCDTSVLIAPSR | 0.000 | 0.000 | 0.000 | 0.806 | 0.000 | 0.000 | 0.000 | 0.194 | ||
| 2 spectra, AVPVTR | 0.000 | 0.000 | 0.000 | 0.239 | 0.423 | 0.000 | 0.259 | 0.079 | ||
| 2 spectra, APHVQASAR | 0.000 | 0.000 | 0.000 | 0.147 | 0.621 | 0.000 | 0.000 | 0.232 |
| Plot | Mito | Lyso or Perox | ER | Golgi | PM | Cytosol | Nucleus | ||||||
| Expt B |
3 peptides |
5 spectra |
 |
0.023 0.000 | 0.080 |
0.000 0.000 | 0.131 |
0.323 0.120 | 0.521 |
0.534 0.319 | 0.727 |
0.120 0.000 | 0.138 |
0.000 0.000 | 0.002 |
0.000 0.000 | 0.066 |
|||
| Plot | Lyso | Other | |||||||||||
| Expt C |
3 peptides |
4 spectra |
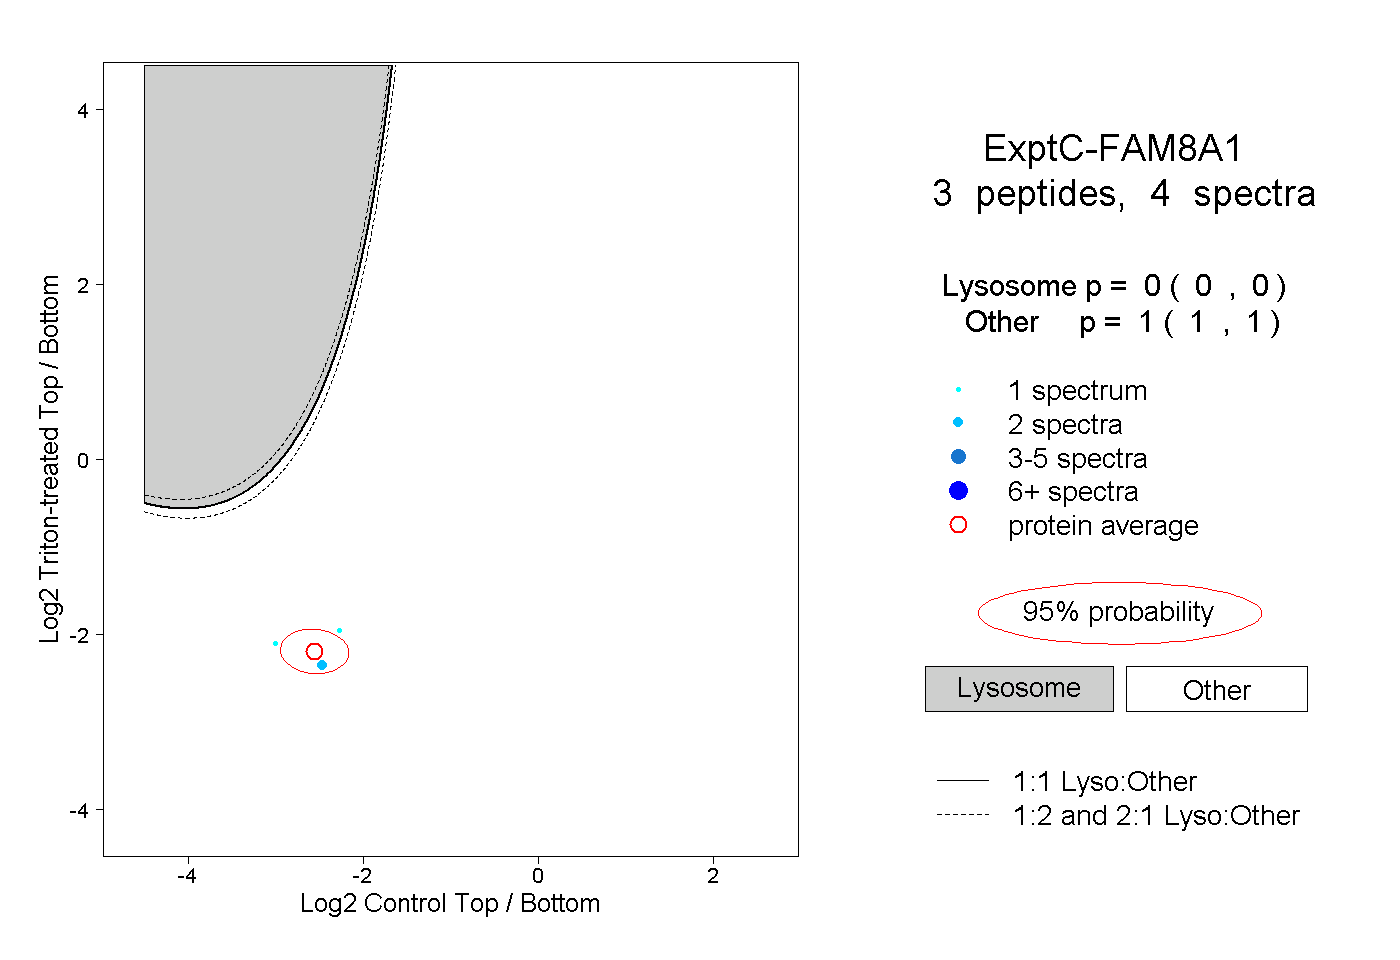 |
0.000 0.000 | 0.000 |
1.000 1.000 | 1.000 |