 4
4peptides
spectra

0.708 | 0.894
0.000 | 0.048
0.000 | 0.195
0.000 | 0.077
0.000 | 0.000
0.000 | 0.140
0.000 | 0.006
0.000 | 0.063
9peptides
spectra

0.000 | 0.000
1.000 | 1.000
3peptides
spectra
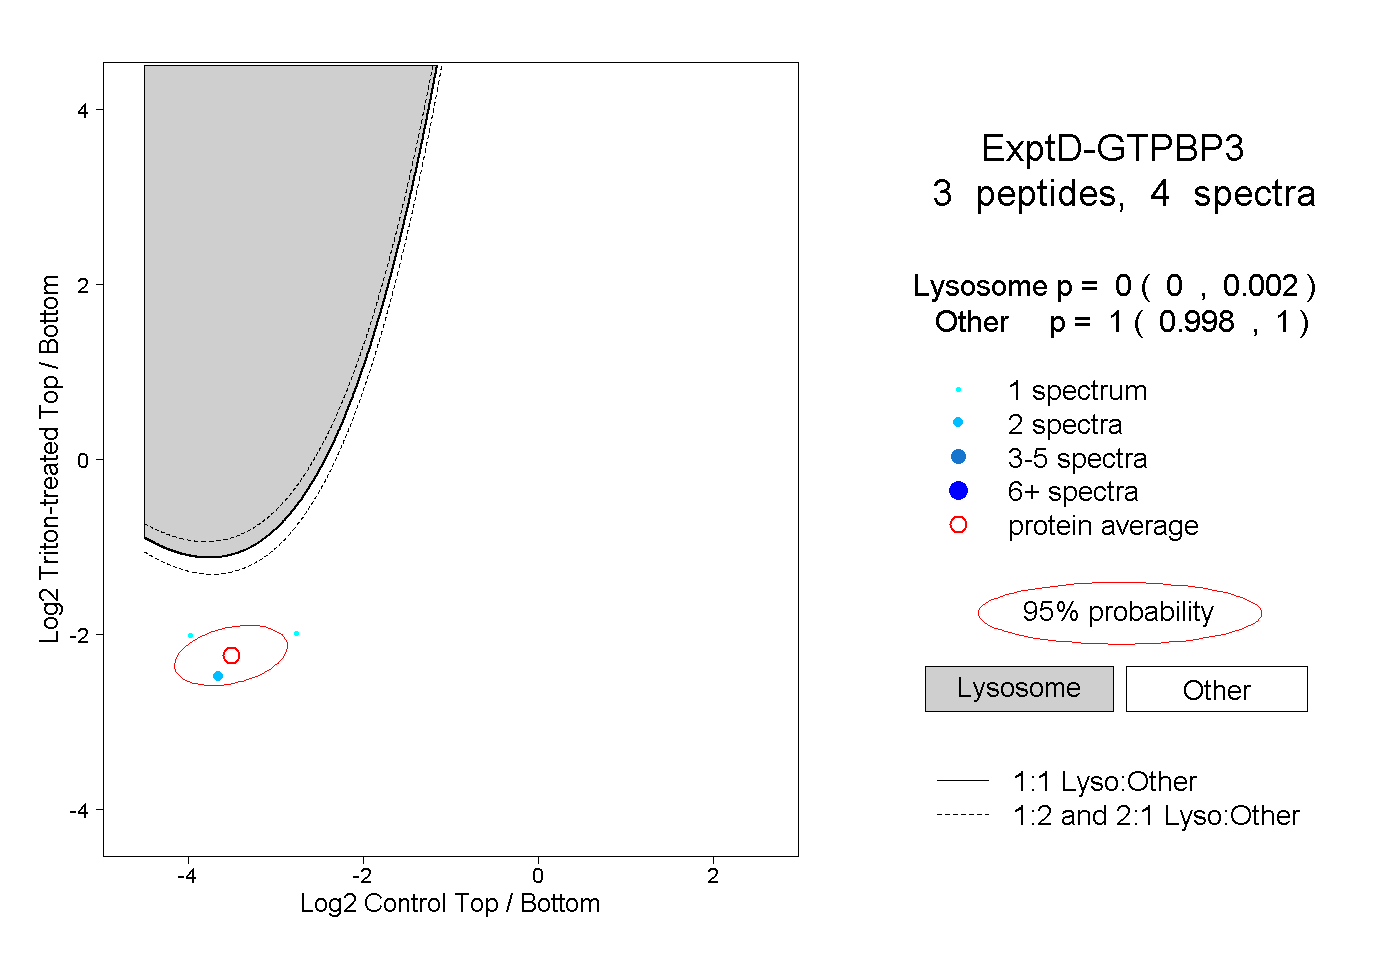
0.000 | 0.002
0.998 | 1.000