 4
4peptides
spectra

0.708 | 0.894
0.000 | 0.048
0.000 | 0.195
0.000 | 0.077
0.000 | 0.000
0.000 | 0.140
0.000 | 0.006
0.000 | 0.063
| Plot | Mito | Lyso | Perox | ER | Golgi | PM | Cytosol | Nucleus | |||||
| Expt A |
4 peptides |
4 spectra |
|
0.800 0.708 | 0.894 |
0.000 0.000 | 0.048 |
0.148 0.000 | 0.195 |
0.000 0.000 | 0.077 |
0.000 0.000 | 0.000 |
0.009 0.000 | 0.140 |
0.000 0.000 | 0.006 |
0.043 0.000 | 0.063 |
| 1 spectrum, EPPAPR | 0.568 | 0.000 | 0.158 | 0.000 | 0.000 | 0.156 | 0.118 | 0.000 | ||
| 1 spectrum, TELAAVCGDPSTGPPLLTR | 0.879 | 0.000 | 0.000 | 0.000 | 0.000 | 0.000 | 0.000 | 0.121 | ||
| 1 spectrum, LSLTEVEGLADLIHAETEAQR | 0.850 | 0.076 | 0.017 | 0.000 | 0.000 | 0.000 | 0.057 | 0.000 | ||
| 1 spectrum, HPCSGEPLDR | 0.522 | 0.000 | 0.208 | 0.011 | 0.000 | 0.258 | 0.000 | 0.000 |
| Plot | Lyso | Other | |||||||||||
| Expt C |
9 peptides |
15 spectra |
 |
0.000 0.000 | 0.000 |
1.000 1.000 | 1.000 |
||||||||
| Plot | Lyso | Other | |||||||||||
| Expt D |
3 peptides |
4 spectra |
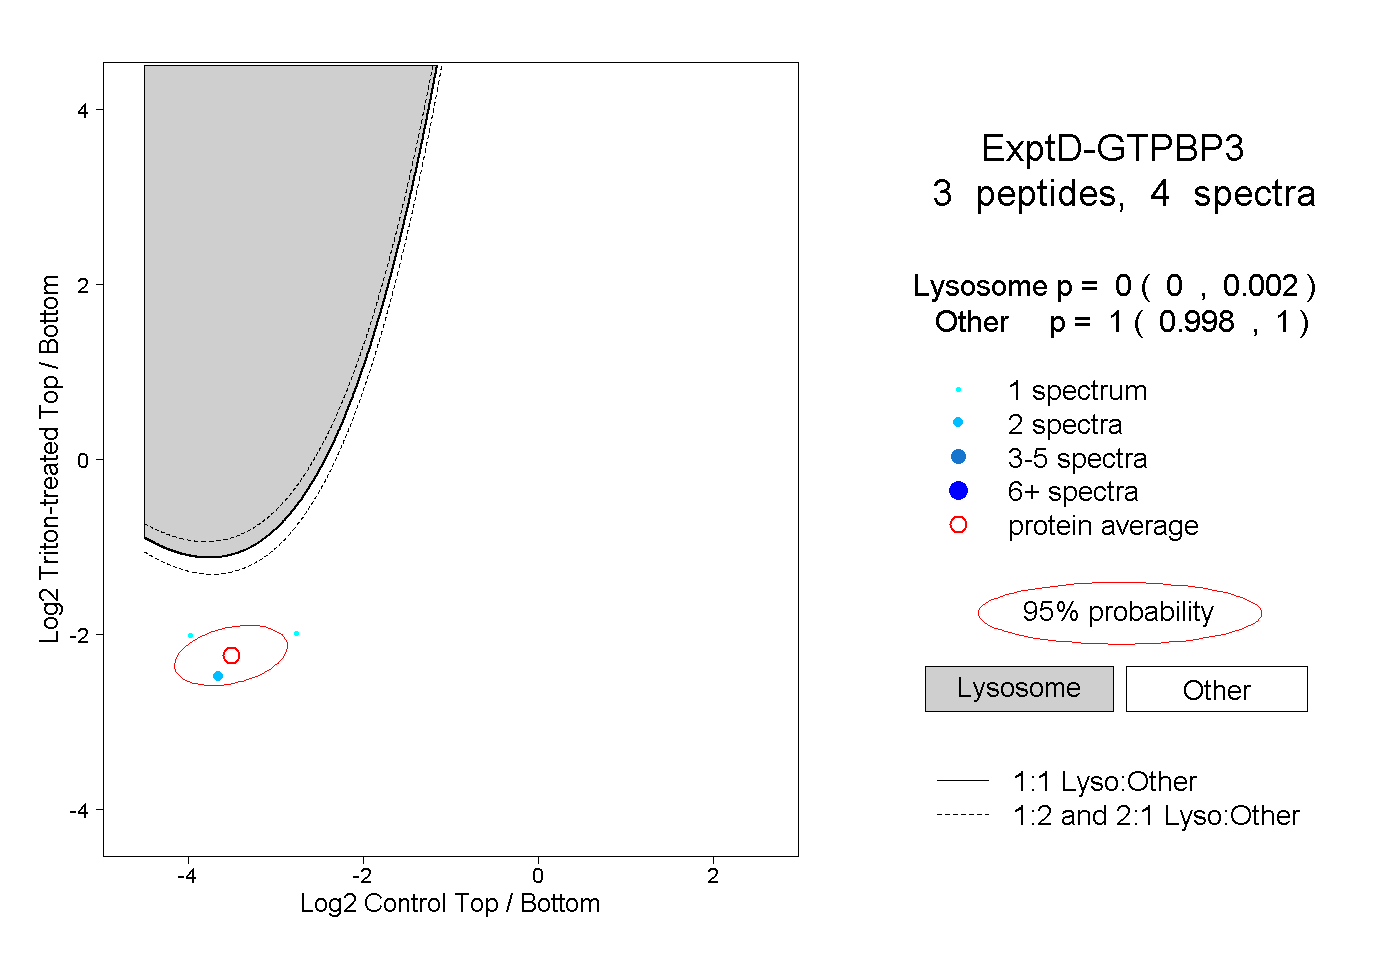 |
0.000 0.000 | 0.002 |
1.000 0.998 | 1.000 |