 5
5peptides
spectra
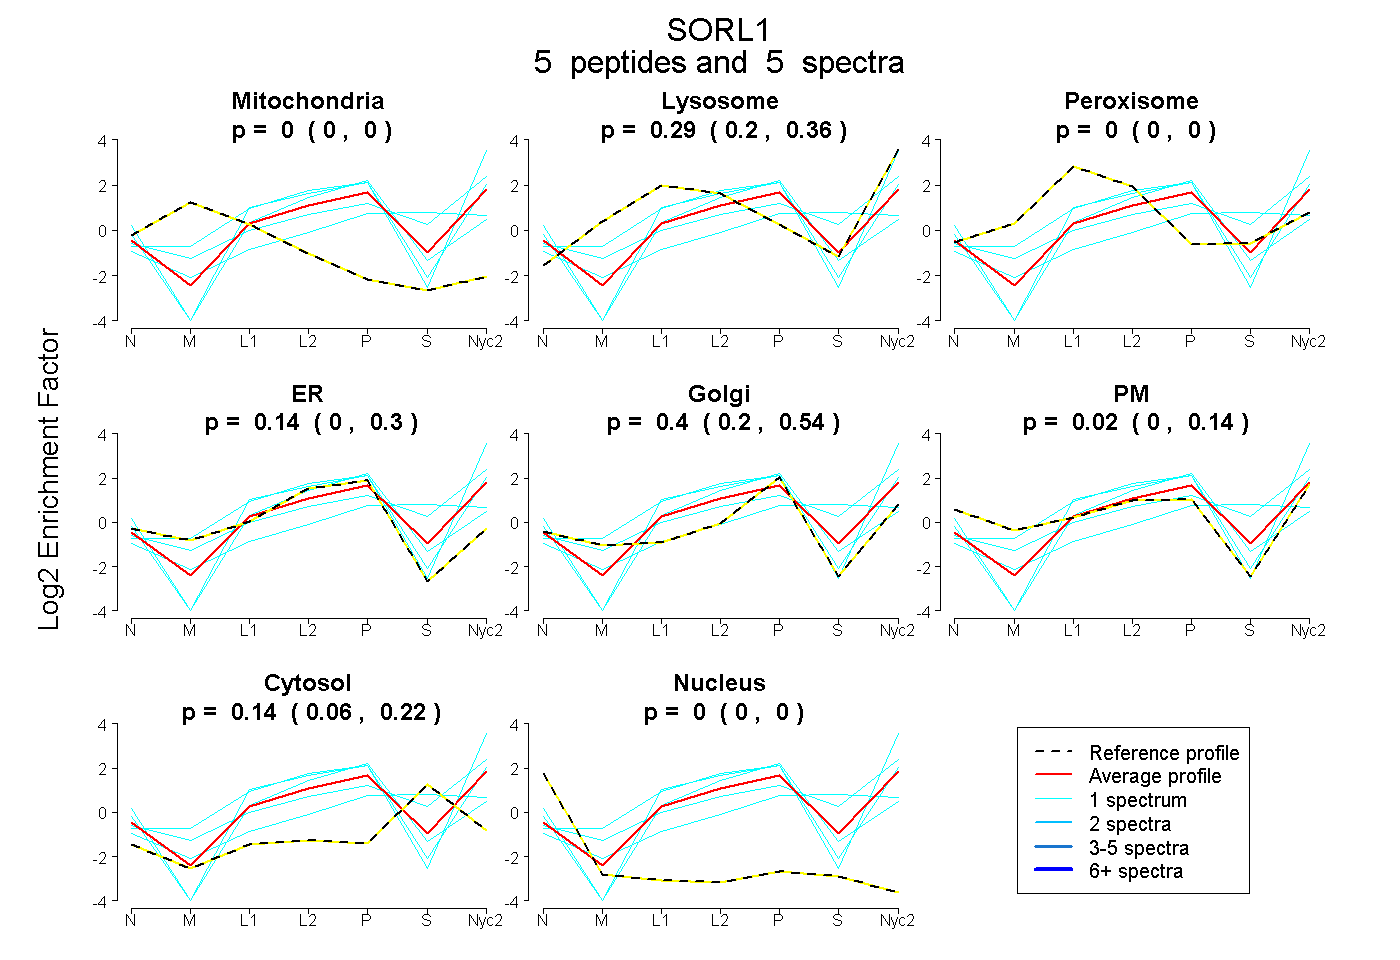
0.000 | 0.000
0.199 | 0.359
0.000 | 0.000
0.000 | 0.296
0.196 | 0.540
0.000 | 0.140
0.059 | 0.215
0.000 | 0.000
10peptides
spectra
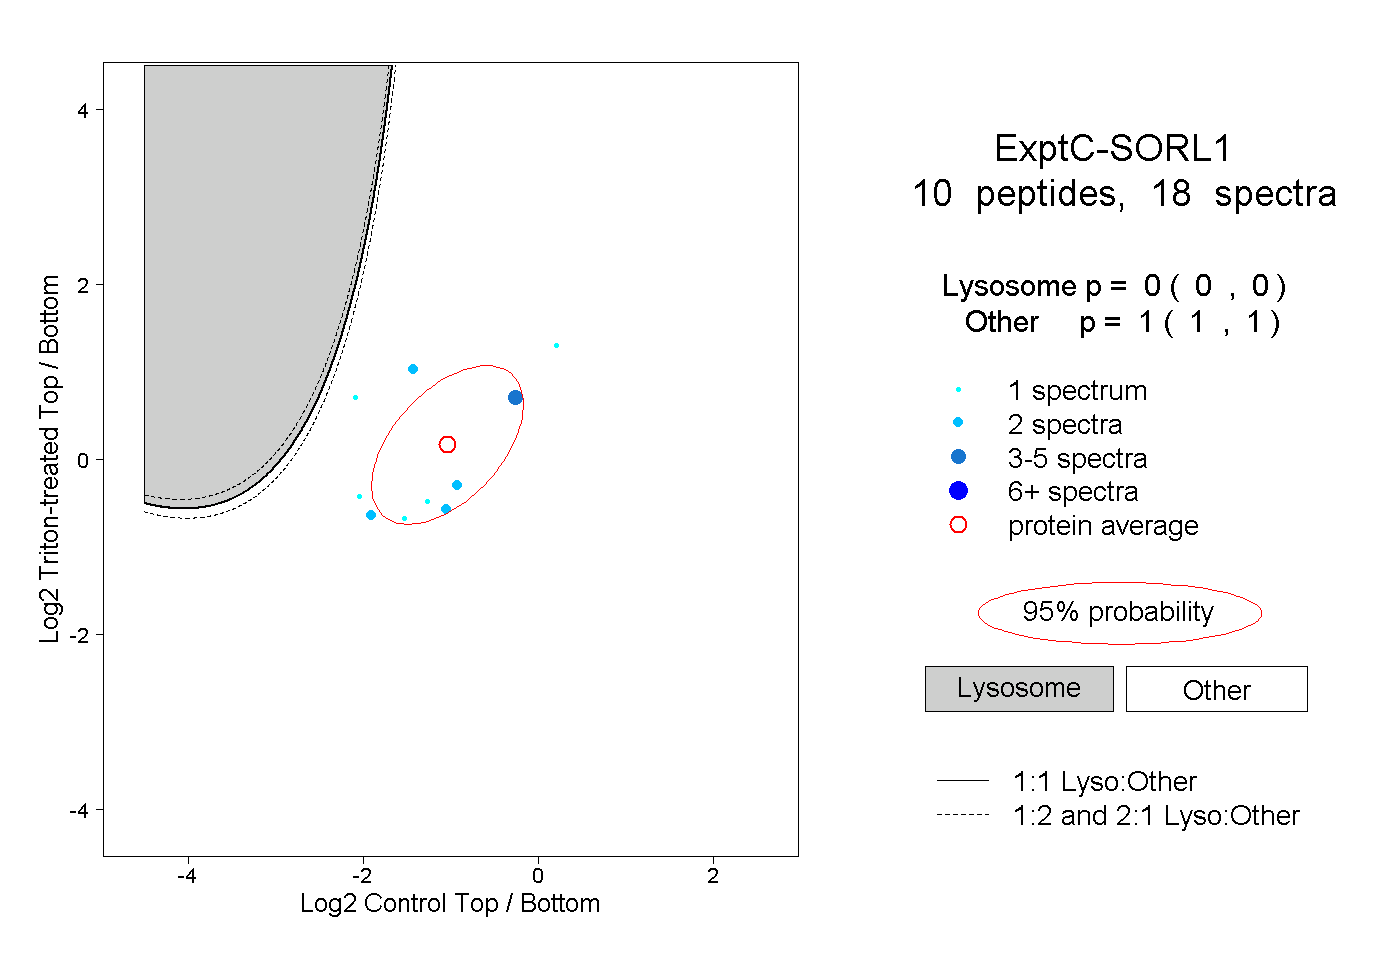
0.000 | 0.000
1.000 | 1.000
2peptides
spectra
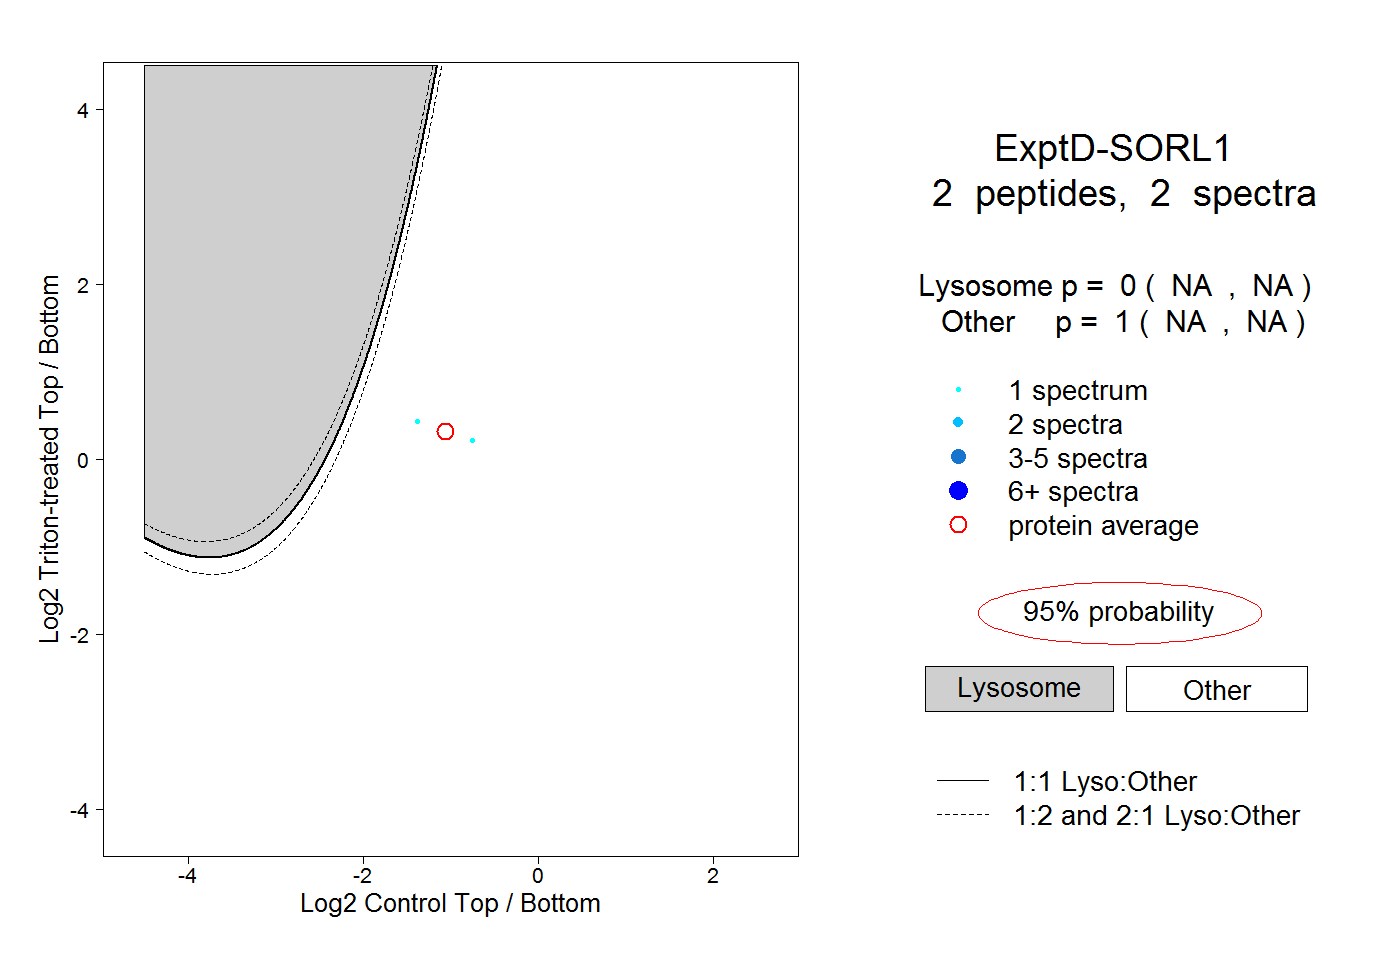
NA | NA
NA | NA