 5
5peptides
spectra
0.000 | 0.000
0.199 | 0.359
0.000 | 0.000
0.000 | 0.296
0.196 | 0.540
0.000 | 0.140
0.059 | 0.215
0.000 | 0.000
10peptides
spectra
0.000 | 0.000
1.000 | 1.000
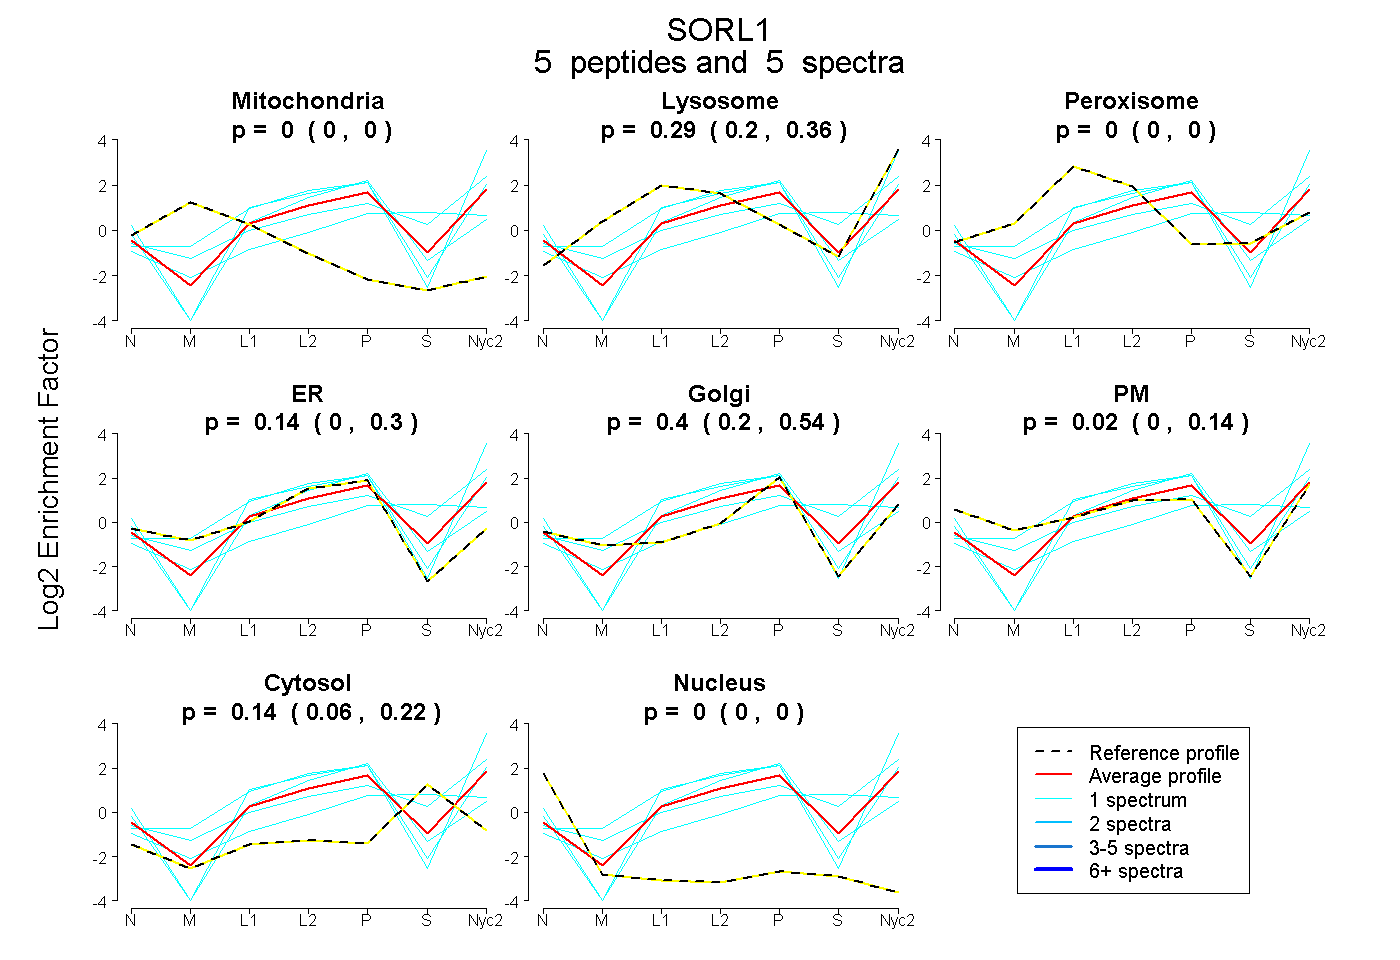
| Plot | Mito | Lyso | Perox | ER | Golgi | PM | Cytosol | Nucleus | |||||
| Expt A |
5 peptides |
5 spectra |
|
0.000 0.000 | 0.000 |
0.293 0.199 | 0.359 |
0.000 0.000 | 0.000 |
0.136 0.000 | 0.296 |
0.403 0.196 | 0.540 |
0.023 0.000 | 0.140 |
0.144 0.059 | 0.215 |
0.000 0.000 | 0.000 |
||
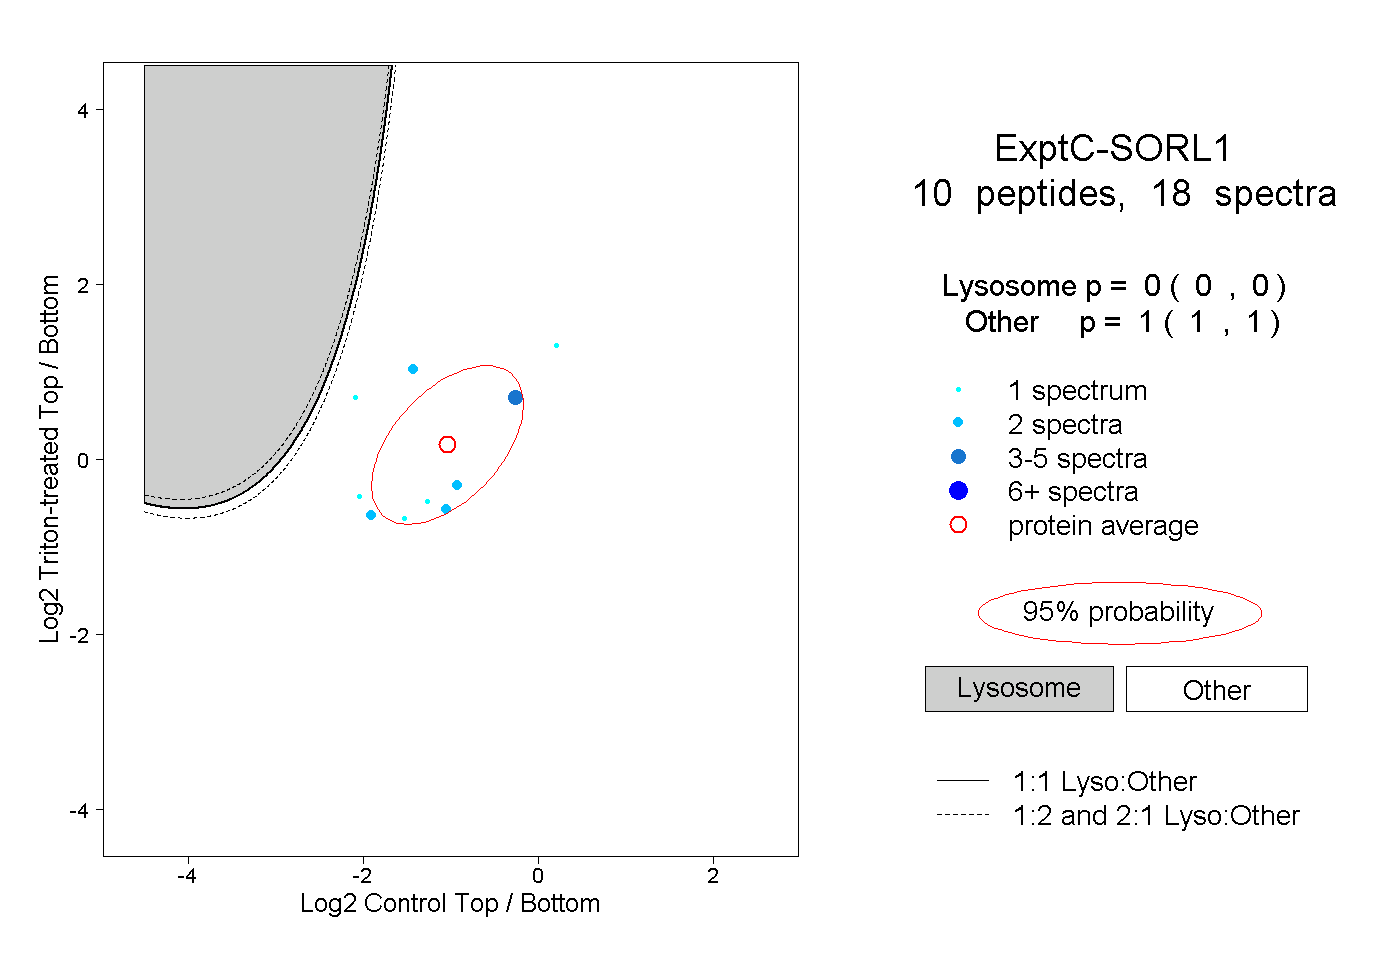
| Plot | Lyso | Other | |||||||||||
| Expt C |
10 peptides |
18 spectra |
|
0.000 0.000 | 0.000 |
1.000 1.000 | 1.000 |
| 2 spectra, AAQFVTK | 0.000 | 1.000 | ||||||||
| 2 spectra, ITFSGQQR | 0.000 | 1.000 | ||||||||
| 5 spectra, VLKPDTTYQVK | 0.000 | 1.000 | ||||||||
| 1 spectrum, DSLALTRPK | 0.000 | 1.000 | ||||||||
| 2 spectra, AADLLLHSK | 0.000 | 1.000 | ||||||||
| 1 spectrum, TSAVIK | 0.000 | 1.000 | ||||||||
| 1 spectrum, SNVIVALAR | 0.000 | 1.000 | ||||||||
| 1 spectrum, ENQEVILEEVR | 0.000 | 1.000 | ||||||||
| 1 spectrum, EYIVEYSR | 0.000 | 1.000 | ||||||||
| 2 spectra, TPEGLPDAPR | 0.000 | 1.000 |
| Plot | Lyso | Other | |||||||||||
| Expt D |
2 peptides |
2 spectra |
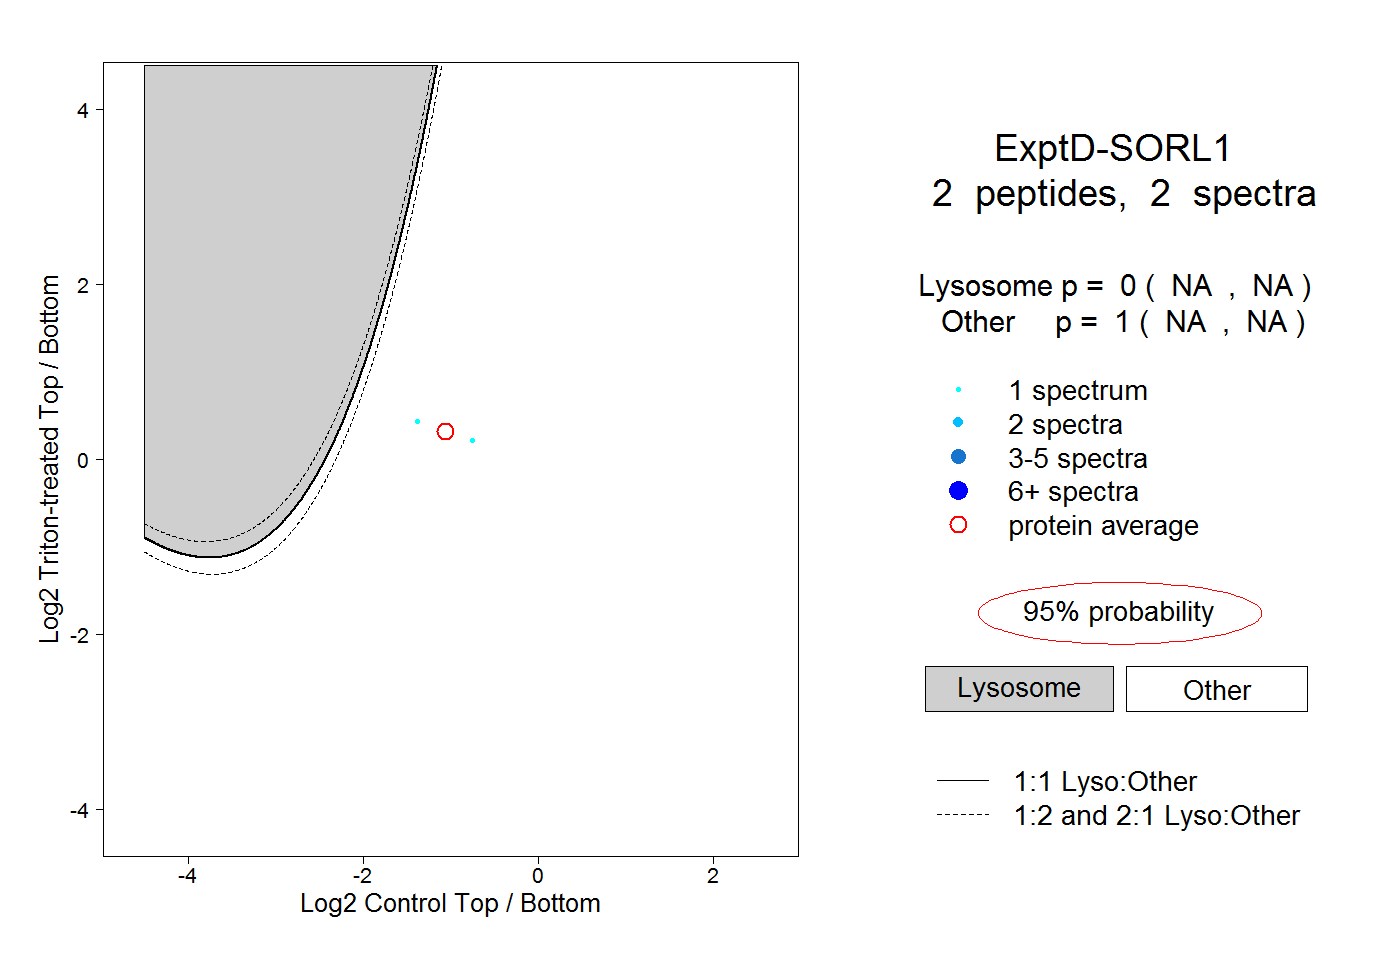 |
0.000 NA | NA |
1.000 NA | NA |