 3
3peptides
spectra
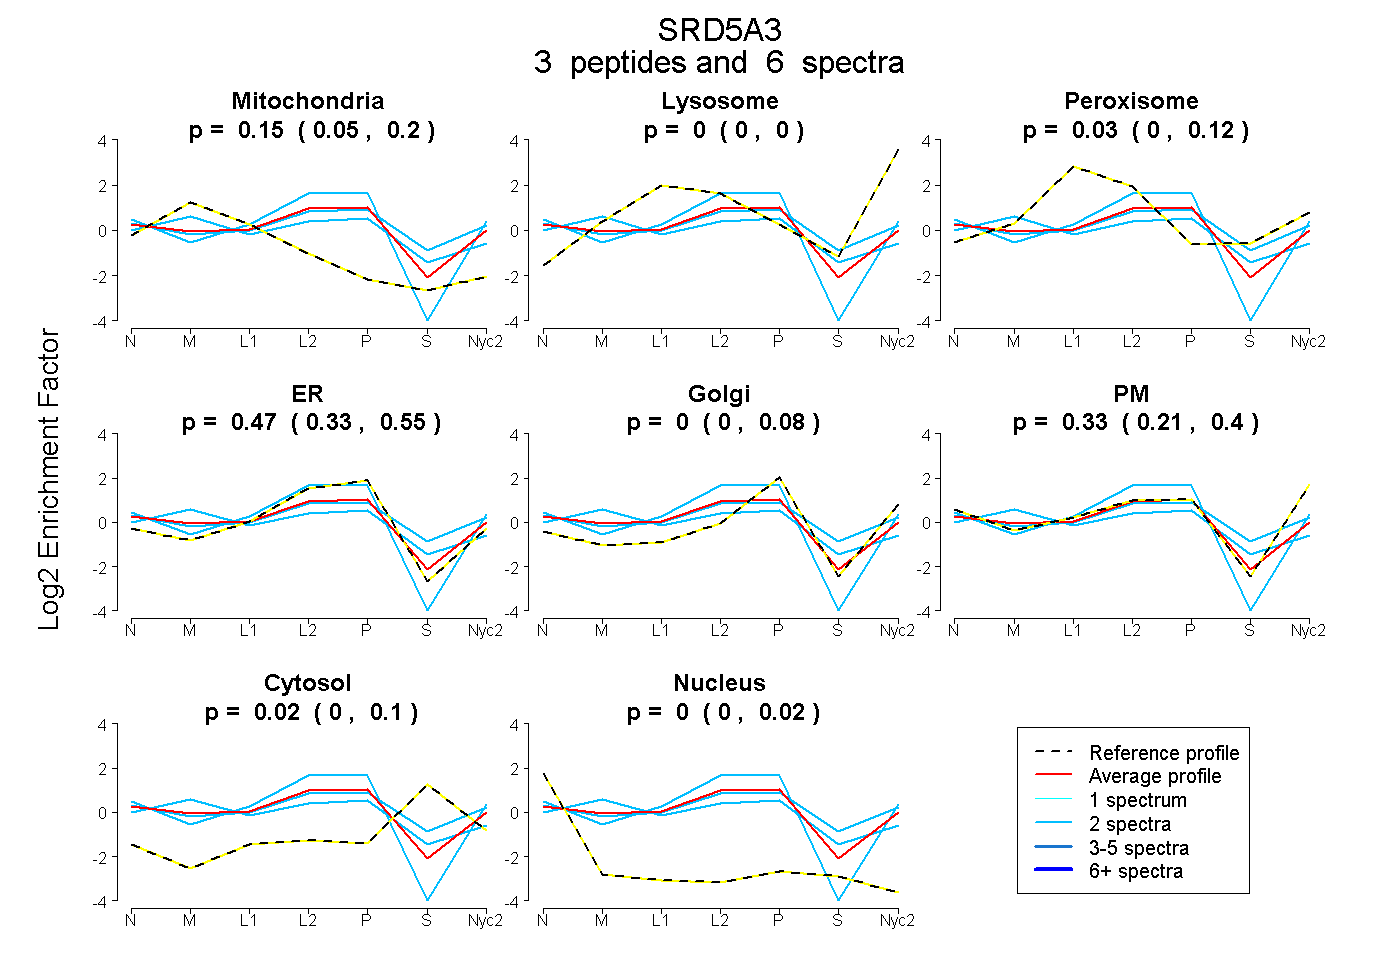
0.051 | 0.199
0.000 | 0.000
0.000 | 0.115
0.330 | 0.548
0.000 | 0.085
0.205 | 0.403
0.000 | 0.100
0.000 | 0.021
1peptide
spectrum
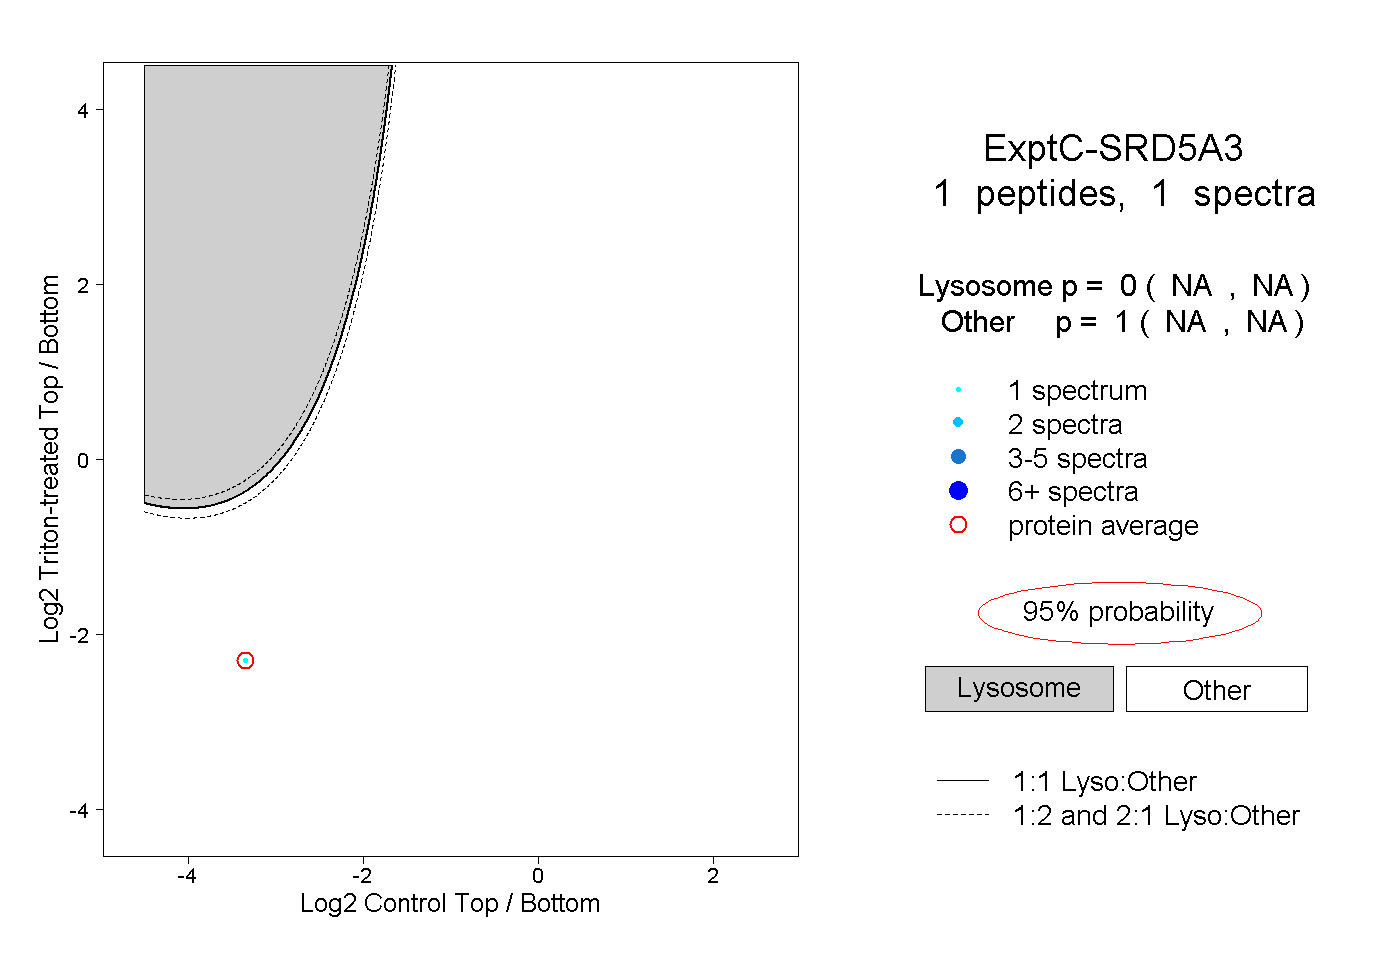
NA | NA
NA | NA
2peptides
spectra
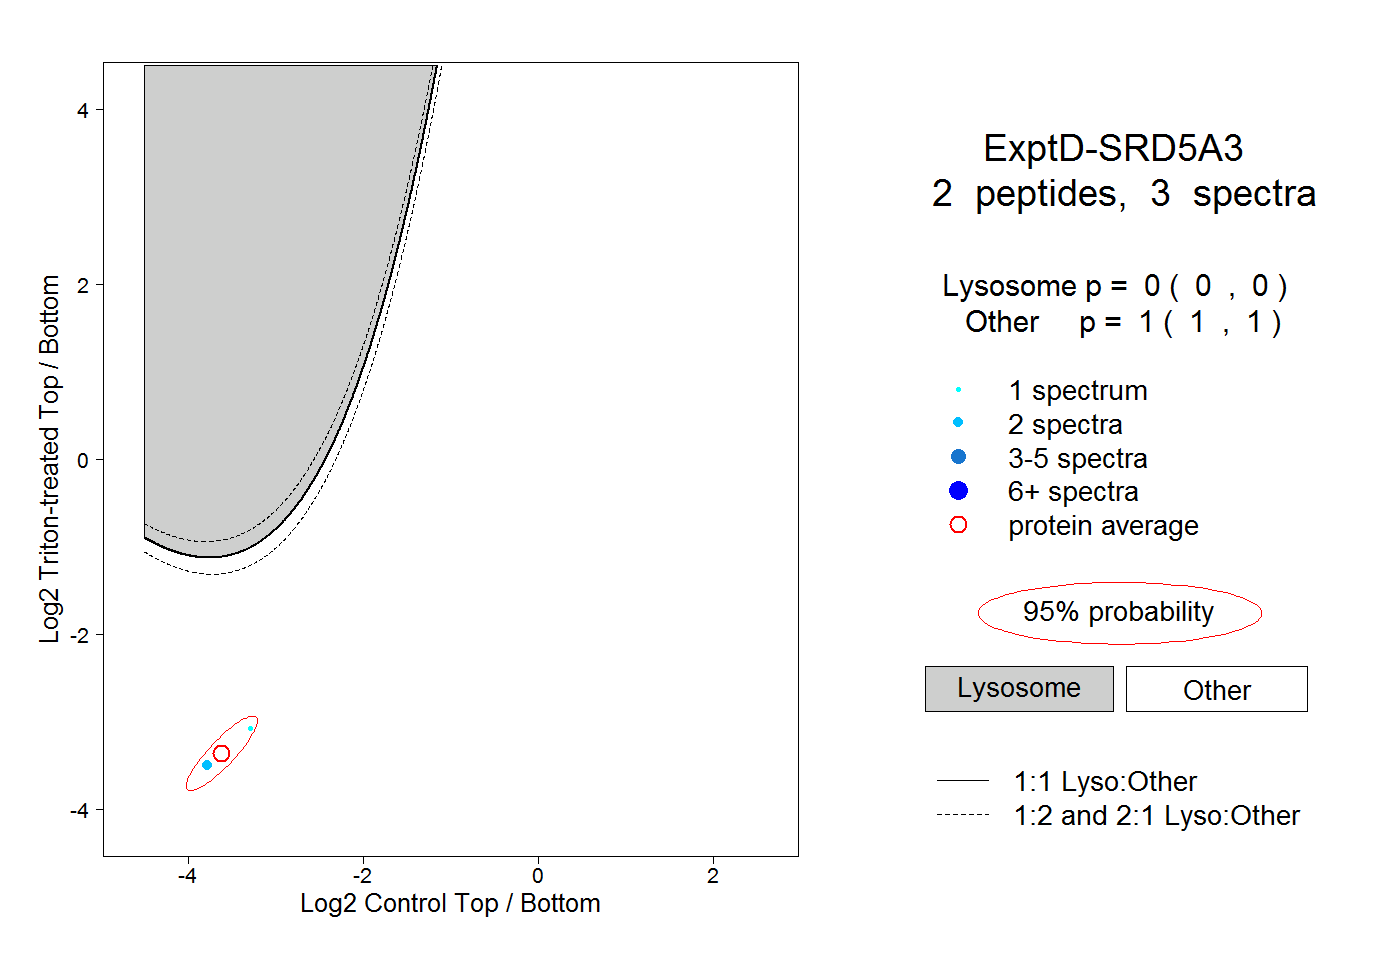
0.000 | 0.000
1.000 | 1.000