 3
3peptides
spectra
0.051 | 0.199
0.000 | 0.000
0.000 | 0.115
0.330 | 0.548
0.000 | 0.085
0.205 | 0.403
0.000 | 0.100
0.000 | 0.021
| Plot | Mito | Lyso | Perox | ER | Golgi | PM | Cytosol | Nucleus | |||||
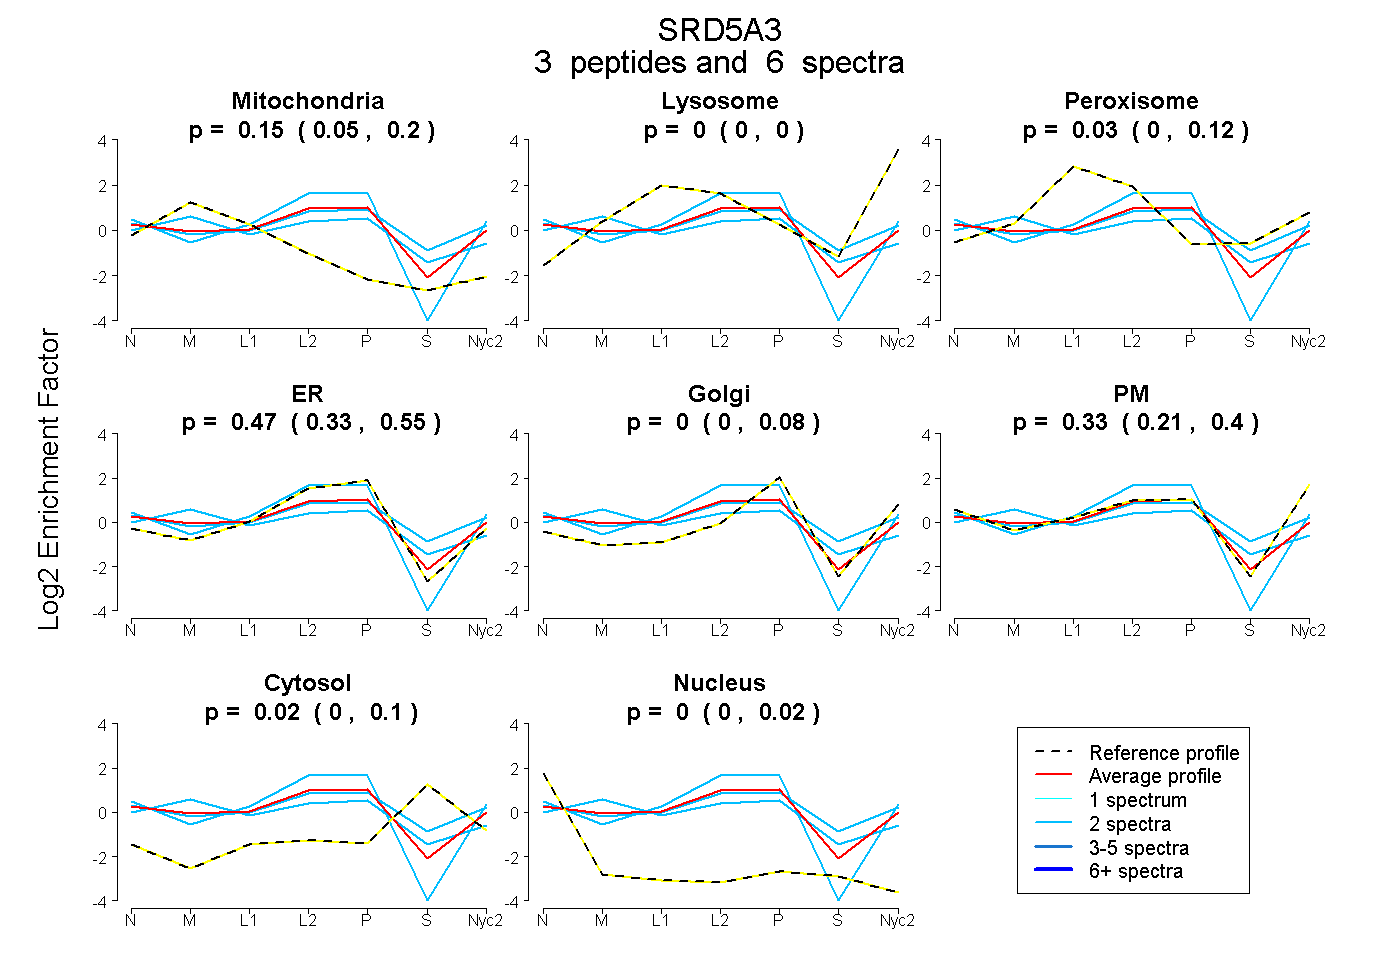
| Expt A |
3 peptides |
6 spectra |
|
0.153 0.051 | 0.199 |
0.000 0.000 | 0.000 |
0.028 0.000 | 0.115 |
0.466 0.330 | 0.548 |
0.000 0.000 | 0.085 |
0.329 0.205 | 0.403 |
0.023 0.000 | 0.100 |
0.000 0.000 | 0.021 |
| 2 spectra, GVVIHCQHR | 0.016 | 0.000 | 0.149 | 0.282 | 0.000 | 0.359 | 0.193 | 0.000 | ||
| 2 spectra, NLLLQAR | 0.000 | 0.000 | 0.000 | 0.671 | 0.000 | 0.329 | 0.000 | 0.000 | ||
| 2 spectra, AFDVPK | 0.306 | 0.000 | 0.126 | 0.278 | 0.191 | 0.041 | 0.058 | 0.000 |
| Plot | Lyso | Other | |||||||||||
| Expt C |
1 peptide |
1 spectrum |
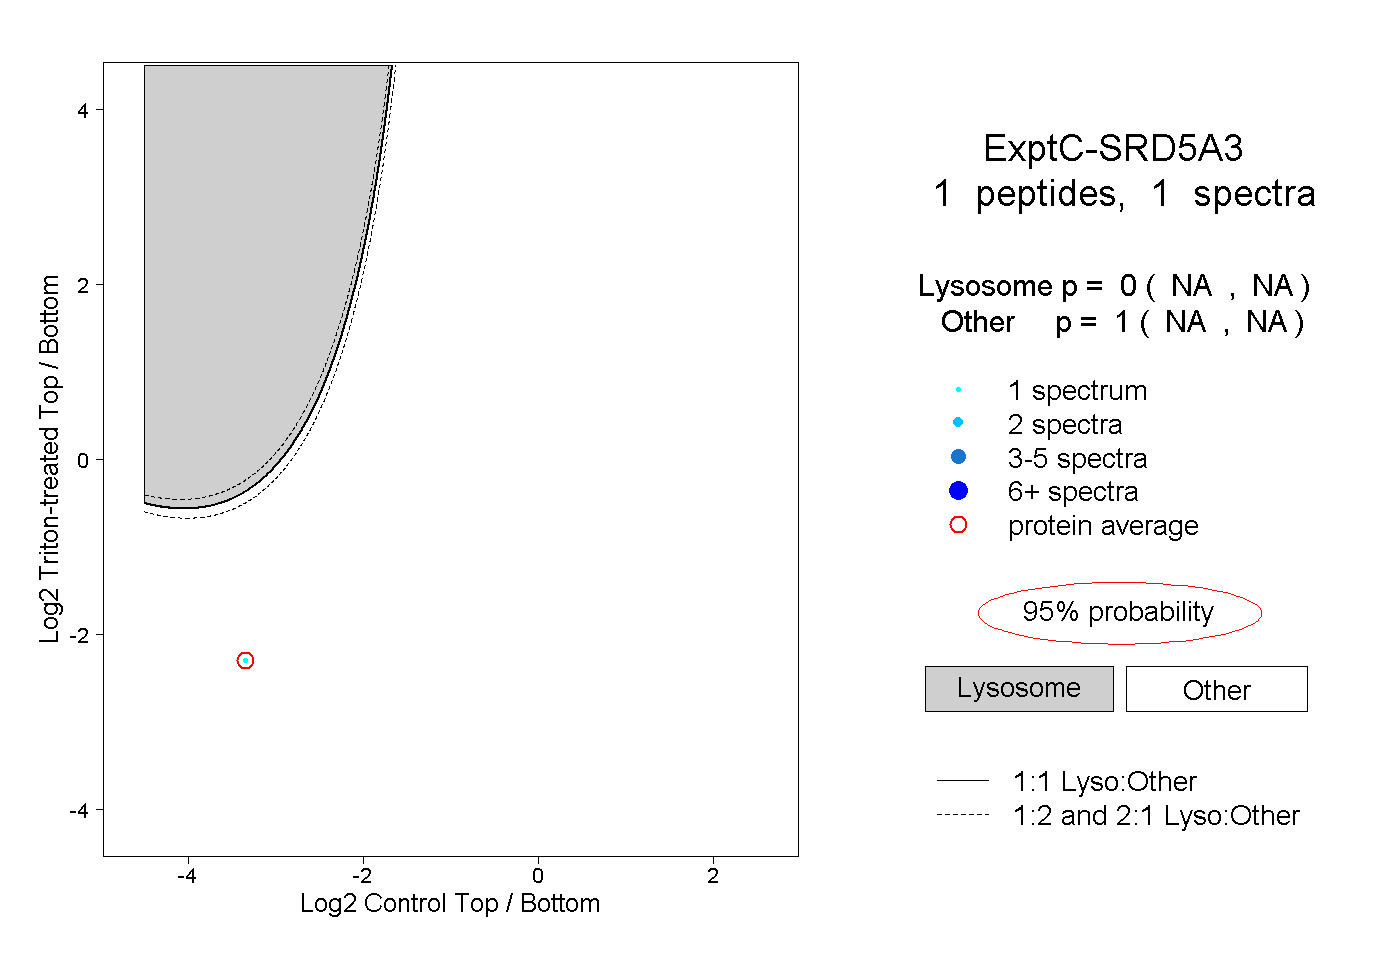 |
0.000 NA | NA |
1.000 NA | NA |
||||||||
| Plot | Lyso | Other | |||||||||||
| Expt D |
2 peptides |
3 spectra |
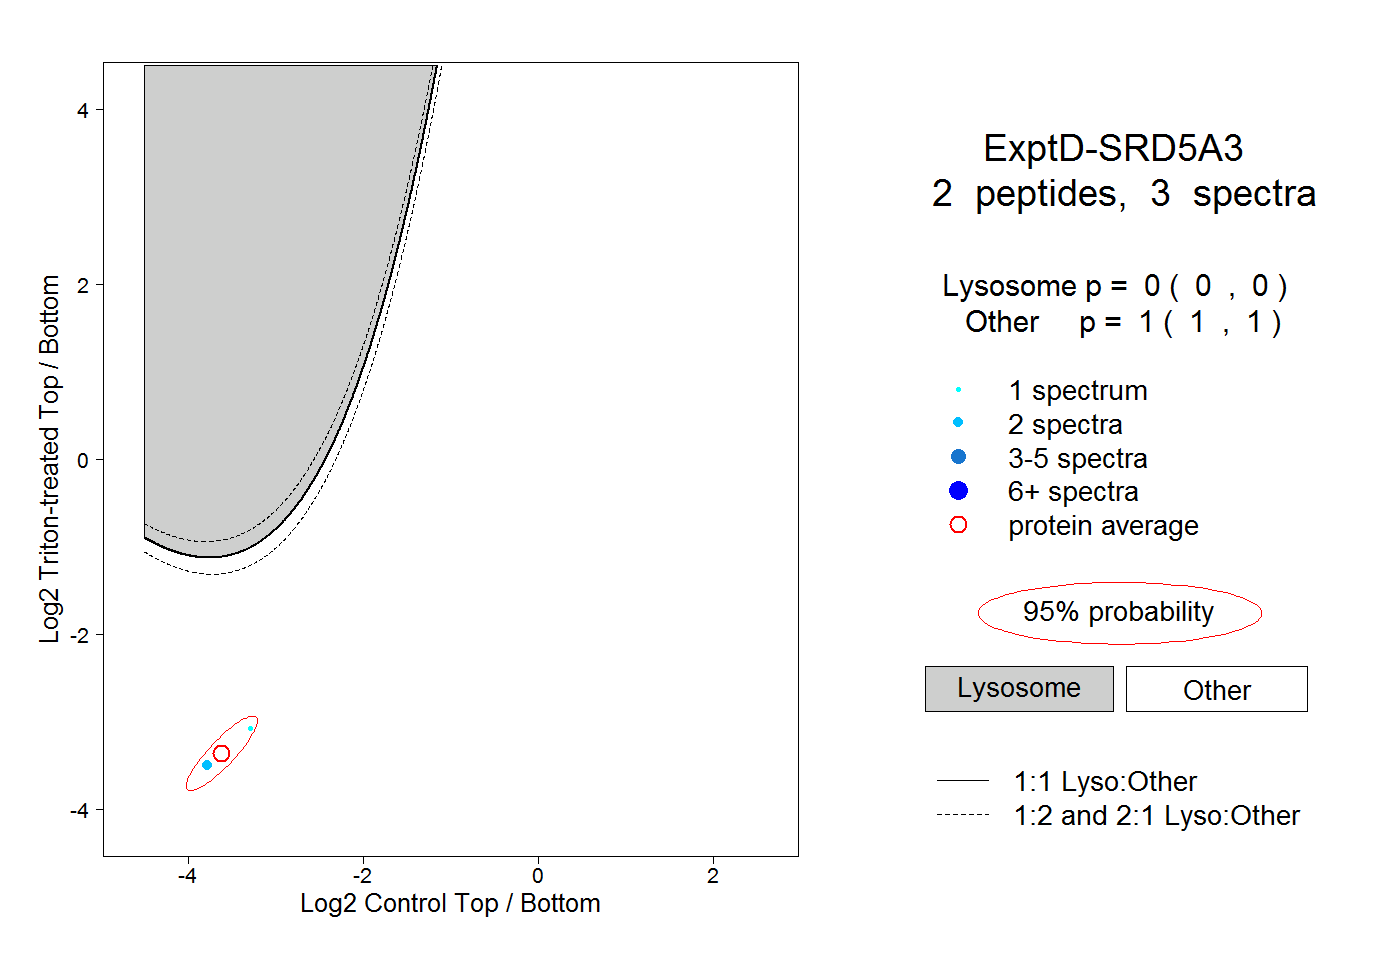 |
0.000 0.000 | 0.000 |
1.000 1.000 | 1.000 |