 36
36peptides
spectra

0.000 | 0.000
0.454 | 0.466
0.000 | 0.000
0.000 | 0.000
0.326 | 0.340
0.195 | 0.215
0.000 | 0.000
0.000 | 0.000
6peptides
spectra
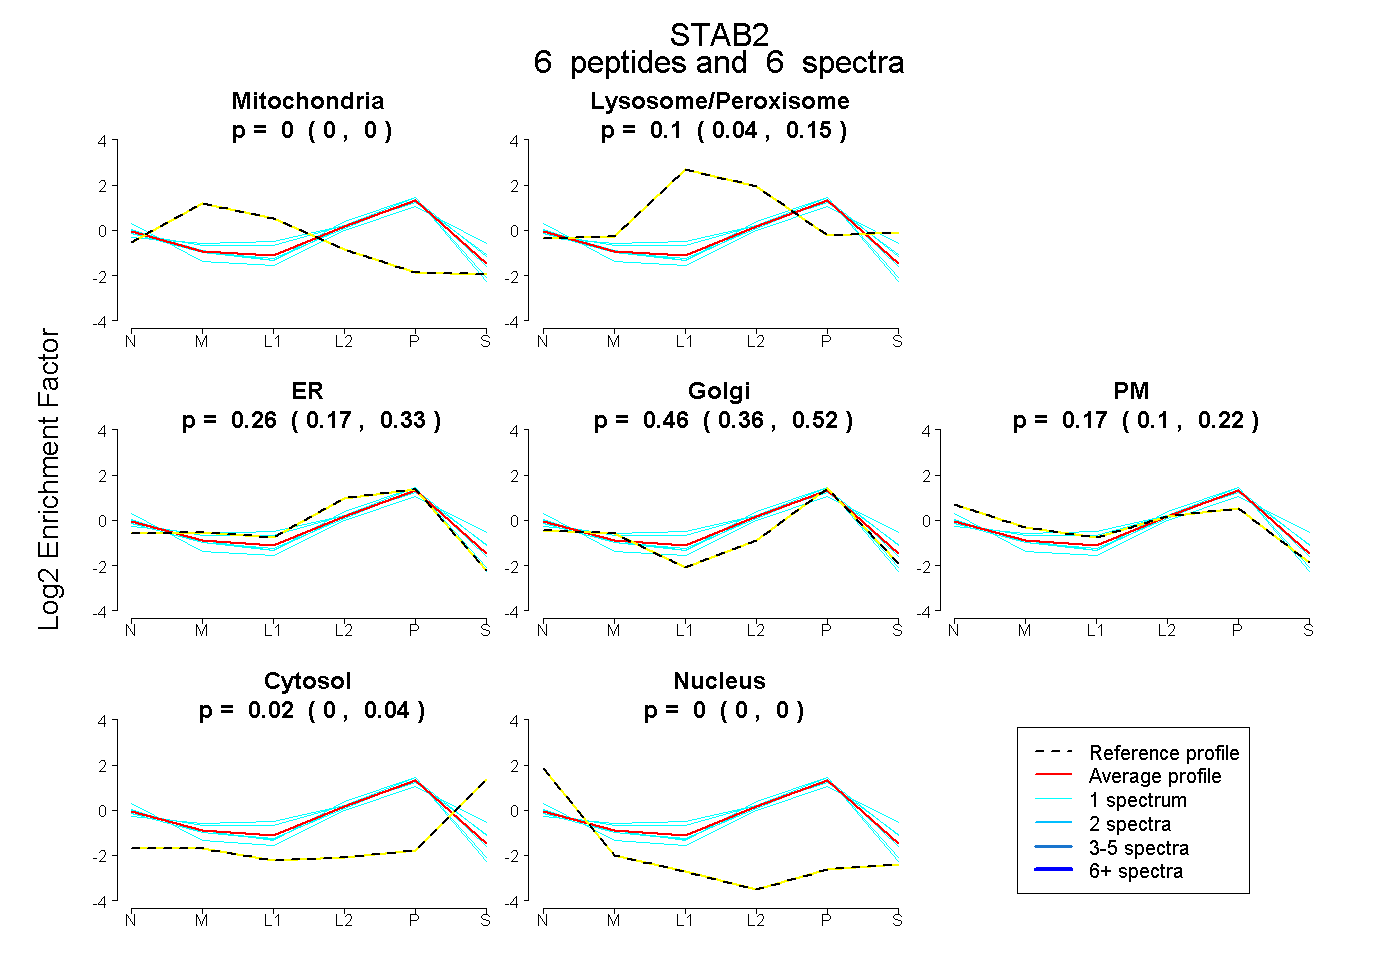
0.000 | 0.000
0.042 | 0.152
0.168 | 0.332
0.358 | 0.525
0.102 | 0.220
0.000 | 0.041
0.000 | 0.000
38peptides
spectra
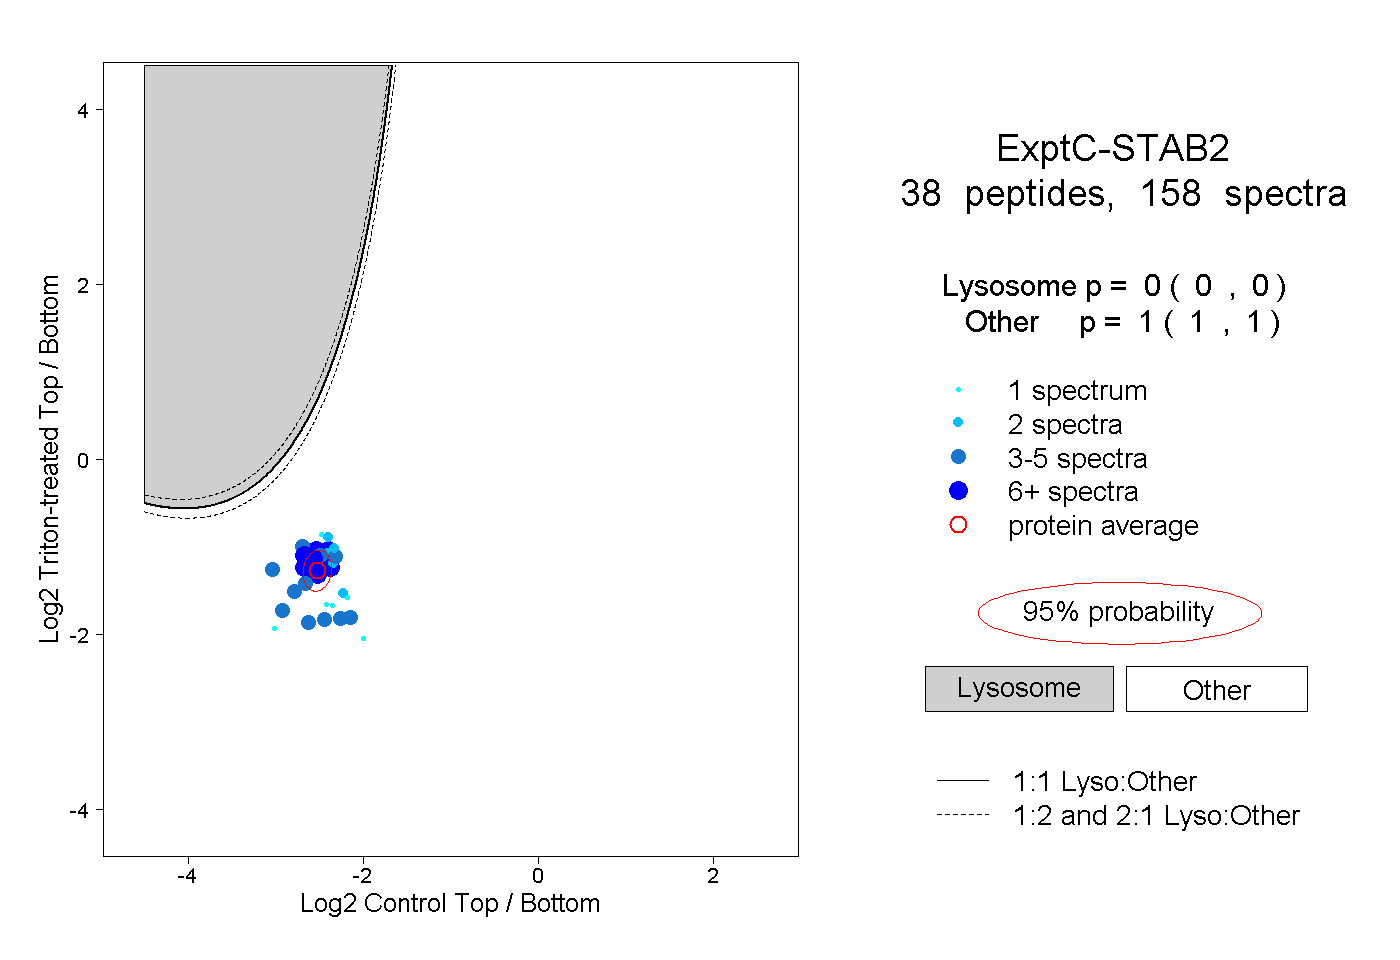
0.000 | 0.000
1.000 | 1.000
5peptides
spectra
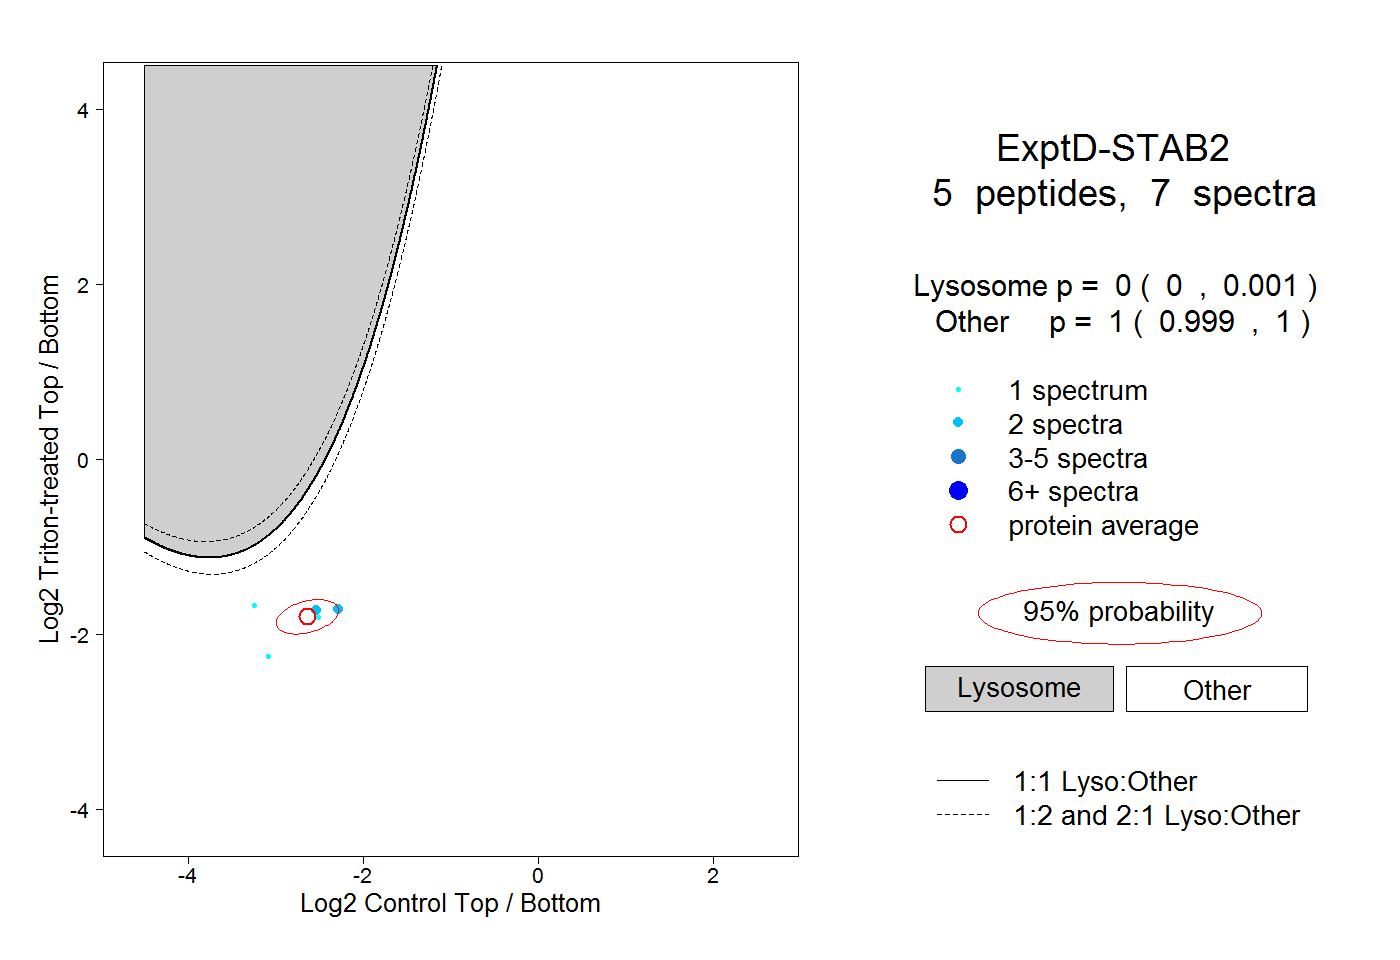
0.000 | 0.001
0.999 | 1.000