 36
36peptides
spectra

0.000 | 0.000
0.454 | 0.466
0.000 | 0.000
0.000 | 0.000
0.326 | 0.340
0.195 | 0.215
0.000 | 0.000
0.000 | 0.000
| Plot | Mito | Lyso | Perox | ER | Golgi | PM | Cytosol | Nucleus | |||||
| Expt A |
36 peptides |
95 spectra |
|
0.000 0.000 | 0.000 |
0.461 0.454 | 0.466 |
0.000 0.000 | 0.000 |
0.000 0.000 | 0.000 |
0.333 0.326 | 0.340 |
0.206 0.195 | 0.215 |
0.000 0.000 | 0.000 |
0.000 0.000 | 0.000 |
| 1 spectrum, STLTIK | 0.000 | 0.656 | 0.000 | 0.000 | 0.344 | 0.000 | 0.000 | 0.000 | ||
| 1 spectrum, GTQVSCSCK | 0.000 | 0.057 | 0.000 | 0.000 | 0.402 | 0.541 | 0.000 | 0.000 | ||
| 1 spectrum, LGTCVSCSTK | 0.000 | 0.149 | 0.000 | 0.349 | 0.406 | 0.095 | 0.000 | 0.000 | ||
| 2 spectra, YHLCSAGWLESGR | 0.000 | 0.425 | 0.003 | 0.000 | 0.456 | 0.020 | 0.095 | 0.000 | ||
| 6 spectra, CIYNPLPFR | 0.000 | 0.373 | 0.000 | 0.000 | 0.204 | 0.422 | 0.000 | 0.000 | ||
| 1 spectrum, TMLGSQLLITSSQDQLHQETR | 0.000 | 0.250 | 0.000 | 0.000 | 0.000 | 0.750 | 0.000 | 0.000 | ||
| 2 spectra, YHVVLGEK | 0.000 | 0.667 | 0.000 | 0.000 | 0.308 | 0.025 | 0.000 | 0.000 | ||
| 10 spectra, SFWLSR | 0.000 | 0.556 | 0.000 | 0.000 | 0.262 | 0.182 | 0.000 | 0.000 | ||
| 2 spectra, AFEDMDQNEK | 0.000 | 0.545 | 0.000 | 0.000 | 0.158 | 0.297 | 0.000 | 0.000 | ||
| 2 spectra, GVIHGLEK | 0.000 | 0.556 | 0.000 | 0.000 | 0.444 | 0.000 | 0.000 | 0.000 | ||
| 8 spectra, GLTGSLPSLLTR | 0.000 | 0.446 | 0.000 | 0.000 | 0.157 | 0.397 | 0.000 | 0.000 | ||
| 1 spectrum, QNNGGCAK | 0.000 | 0.530 | 0.000 | 0.000 | 0.373 | 0.097 | 0.000 | 0.000 | ||
| 4 spectra, NVEGCQNLCTLVIQTPR | 0.000 | 0.349 | 0.000 | 0.188 | 0.243 | 0.221 | 0.000 | 0.000 | ||
| 3 spectra, CPDGYIK | 0.000 | 0.505 | 0.000 | 0.000 | 0.298 | 0.000 | 0.197 | 0.000 | ||
| 1 spectrum, CSQQAPCPLETKPLR | 0.000 | 0.518 | 0.000 | 0.000 | 0.393 | 0.089 | 0.000 | 0.000 | ||
| 3 spectra, VTSGSAGVR | 0.000 | 0.559 | 0.000 | 0.000 | 0.189 | 0.252 | 0.000 | 0.000 | ||
| 2 spectra, SEMWDVFCYR | 0.000 | 0.423 | 0.000 | 0.101 | 0.312 | 0.163 | 0.000 | 0.000 | ||
| 1 spectrum, NLLITPK | 0.000 | 0.536 | 0.000 | 0.000 | 0.464 | 0.000 | 0.000 | 0.000 | ||
| 1 spectrum, GYVGDGLNCYGNIMQR | 0.000 | 0.780 | 0.035 | 0.000 | 0.130 | 0.000 | 0.055 | 0.000 | ||
| 4 spectra, TLQGSELSVR | 0.000 | 0.497 | 0.000 | 0.000 | 0.240 | 0.263 | 0.000 | 0.000 | ||
| 2 spectra, VAYPTTYASQK | 0.000 | 0.434 | 0.000 | 0.000 | 0.296 | 0.269 | 0.000 | 0.000 | ||
| 1 spectrum, ACCAGFFGPQCQACPGR | 0.000 | 0.191 | 0.000 | 0.656 | 0.153 | 0.000 | 0.000 | 0.000 | ||
| 2 spectra, LDSDGACLSGTCR | 0.000 | 0.591 | 0.000 | 0.000 | 0.221 | 0.187 | 0.000 | 0.000 | ||
| 1 spectrum, LLELVR | 0.000 | 0.426 | 0.000 | 0.000 | 0.009 | 0.566 | 0.000 | 0.000 | ||
| 1 spectrum, CPADSKPATIFSSCFYSSR | 0.000 | 0.324 | 0.000 | 0.241 | 0.183 | 0.253 | 0.000 | 0.000 | ||
| 7 spectra, ELNTEPR | 0.000 | 0.457 | 0.000 | 0.000 | 0.227 | 0.316 | 0.000 | 0.000 | ||
| 1 spectrum, CHPLATCQSTSSGVWSCVCR | 0.000 | 0.169 | 0.000 | 0.000 | 0.707 | 0.124 | 0.000 | 0.000 | ||
| 2 spectra, TECQSCSANFAVK | 0.000 | 0.351 | 0.000 | 0.127 | 0.265 | 0.089 | 0.168 | 0.000 | ||
| 2 spectra, CDKPIPECATLLCPENSR | 0.000 | 0.691 | 0.000 | 0.000 | 0.272 | 0.037 | 0.000 | 0.000 | ||
| 2 spectra, NPSTSQYFFQLQEHAVR | 0.000 | 0.654 | 0.000 | 0.000 | 0.287 | 0.059 | 0.000 | 0.000 | ||
| 4 spectra, ADILDYLLSPEGSR | 0.000 | 0.514 | 0.000 | 0.000 | 0.154 | 0.332 | 0.000 | 0.000 | ||
| 6 spectra, NDLHNGMHR | 0.000 | 0.189 | 0.000 | 0.000 | 0.013 | 0.617 | 0.181 | 0.000 | ||
| 2 spectra, YHILLGK | 0.000 | 0.526 | 0.170 | 0.104 | 0.000 | 0.200 | 0.000 | 0.000 | ||
| 2 spectra, ALASDLPR | 0.000 | 0.358 | 0.000 | 0.000 | 0.163 | 0.480 | 0.000 | 0.000 | ||
| 1 spectrum, CGANVVGIVDYGSR | 0.000 | 0.303 | 0.000 | 0.000 | 0.152 | 0.544 | 0.000 | 0.000 | ||
| 3 spectra, SVFIGCQPQCVR | 0.000 | 0.230 | 0.000 | 0.407 | 0.160 | 0.203 | 0.000 | 0.000 |
| Plot | Mito | Lyso or Perox | ER | Golgi | PM | Cytosol | Nucleus | ||||||
| Expt B |
6 peptides |
6 spectra |
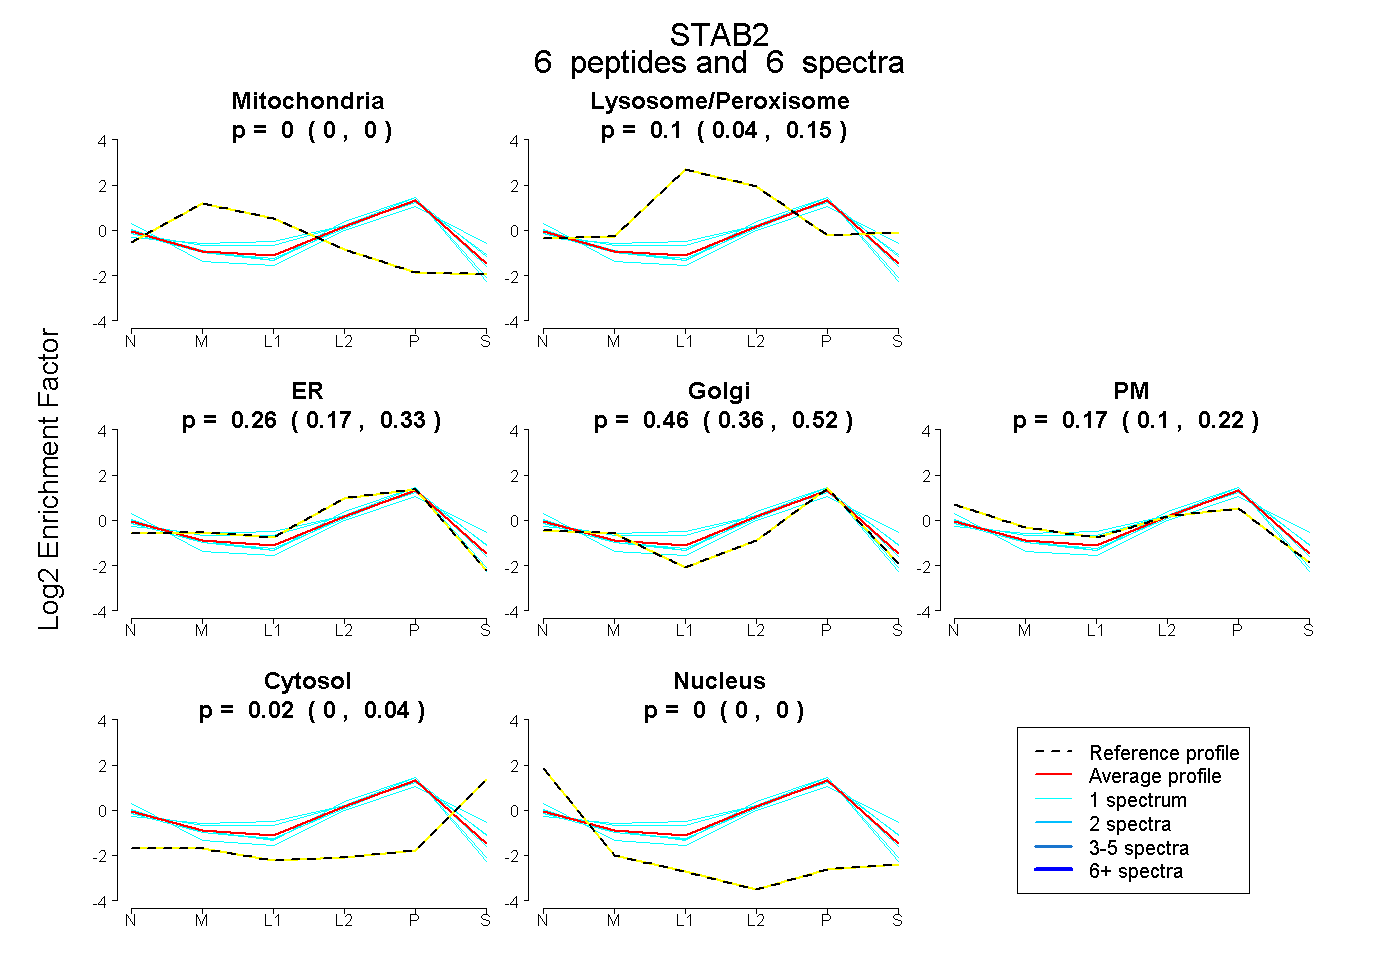 |
0.000 0.000 | 0.000 |
0.105 0.042 | 0.152 |
0.256 0.168 | 0.332 |
0.455 0.358 | 0.525 |
0.168 0.102 | 0.220 |
0.016 0.000 | 0.041 |
0.000 0.000 | 0.000 |
|||
| Plot | Lyso | Other | |||||||||||
| Expt C |
38 peptides |
158 spectra |
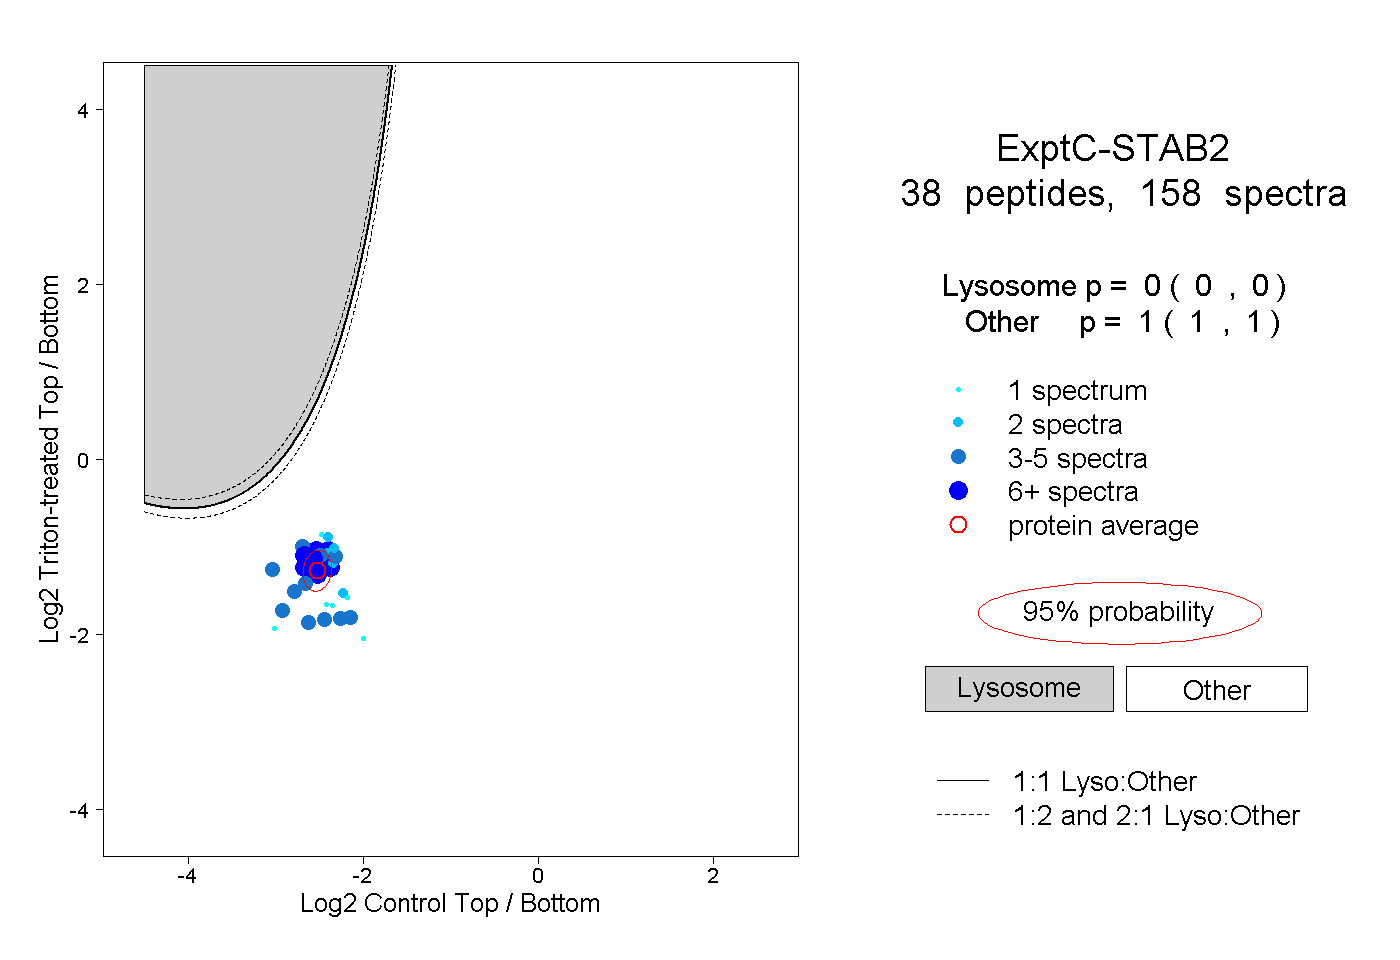 |
0.000 0.000 | 0.000 |
1.000 1.000 | 1.000 |
||||||||
| Plot | Lyso | Other | |||||||||||
| Expt D |
5 peptides |
7 spectra |
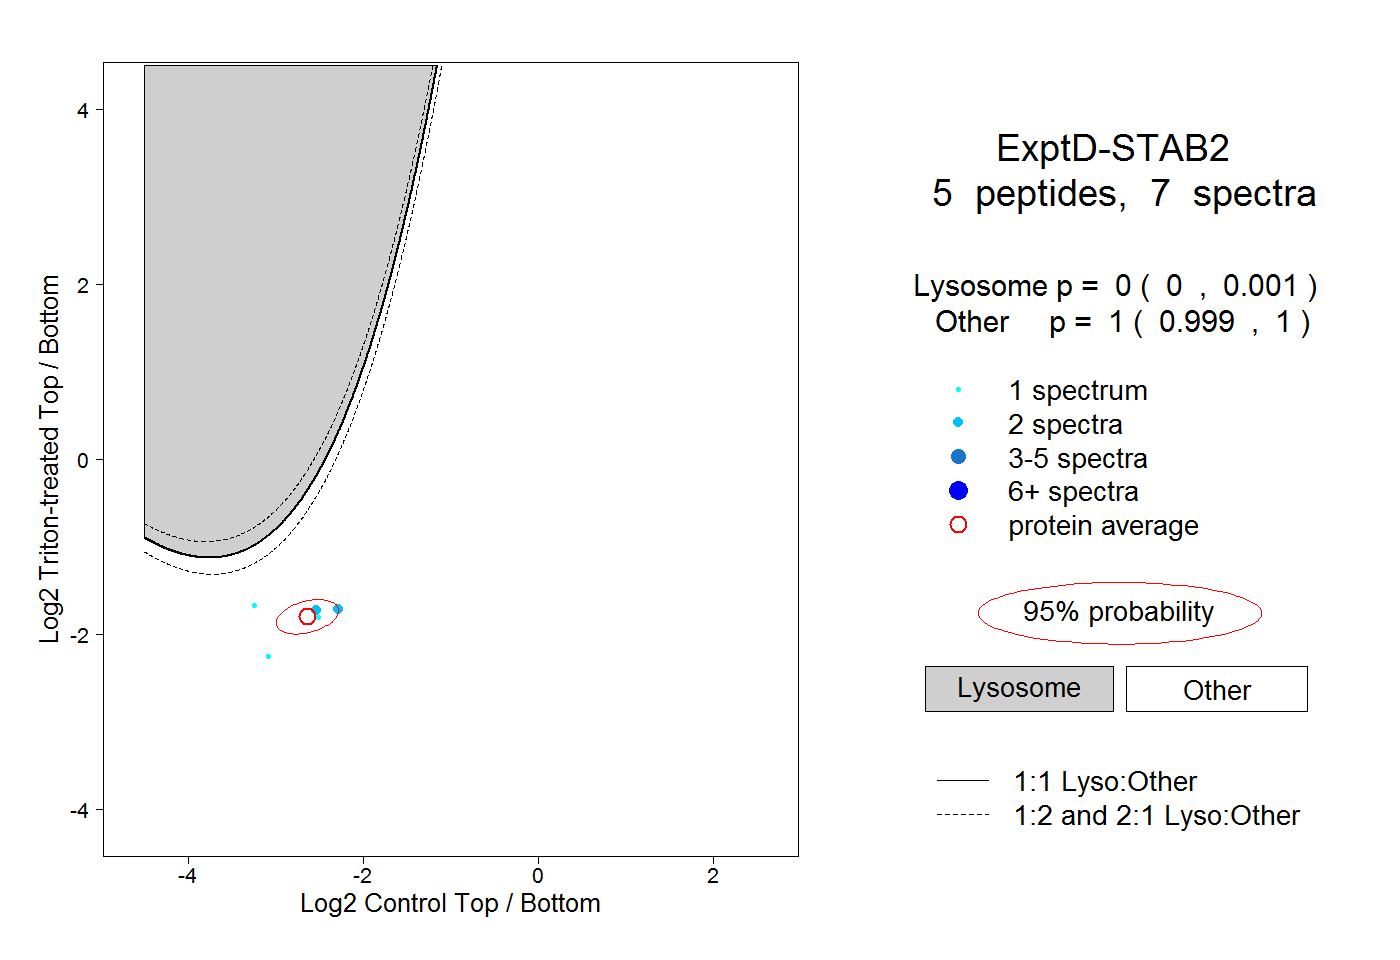 |
0.000 0.000 | 0.001 |
1.000 0.999 | 1.000 |