 11
11peptides
spectra
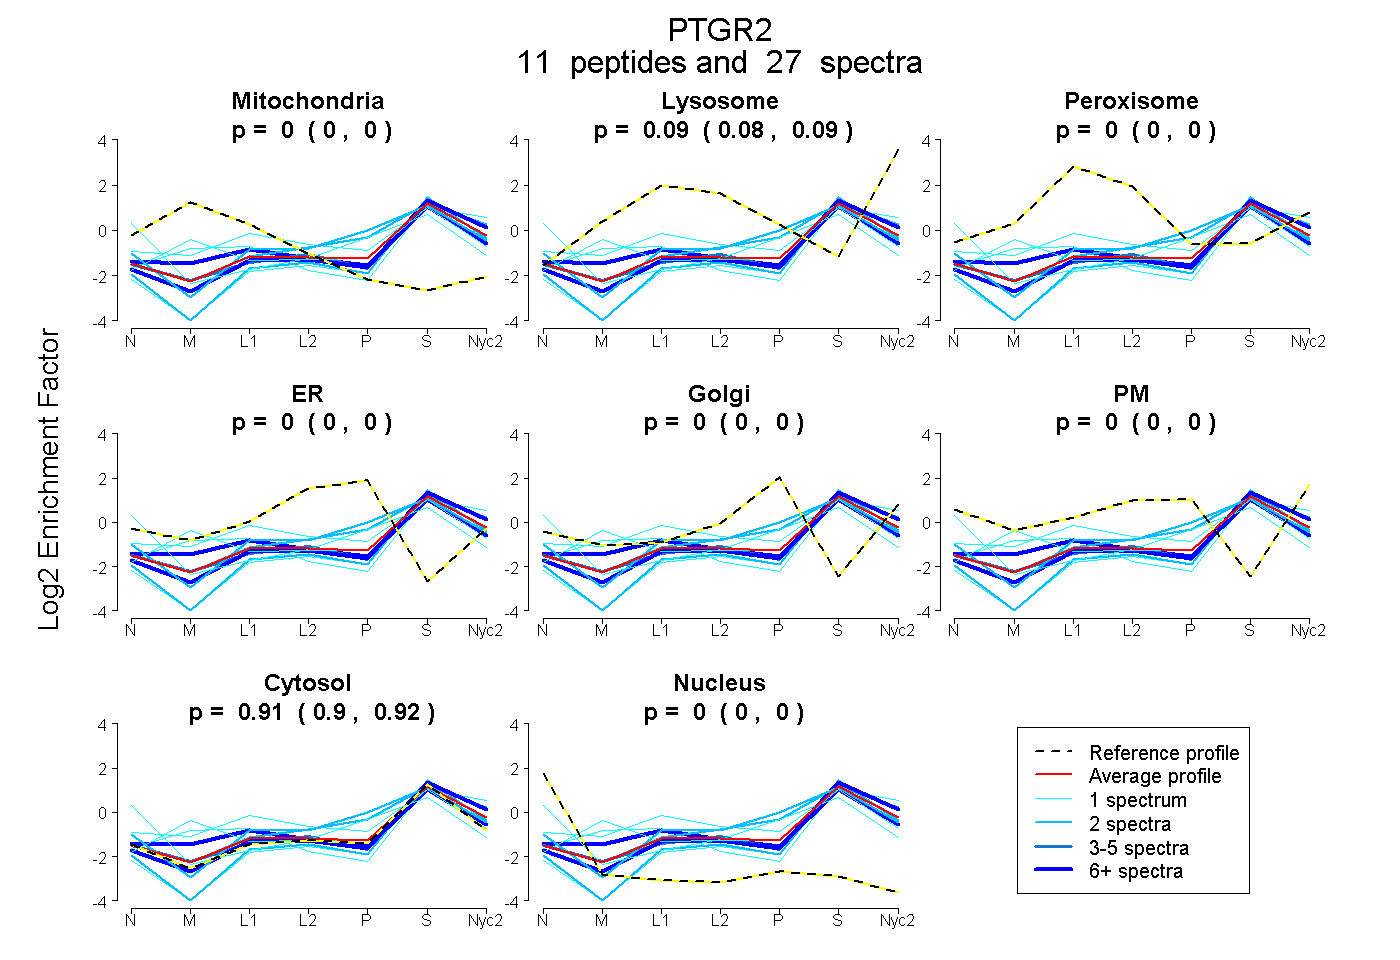
0.000 | 0.000
0.080 | 0.094
0.000 | 0.000
0.000 | 0.000
0.000 | 0.000
0.000 | 0.000
0.904 | 0.919
0.000 | 0.000
4peptides
spectra
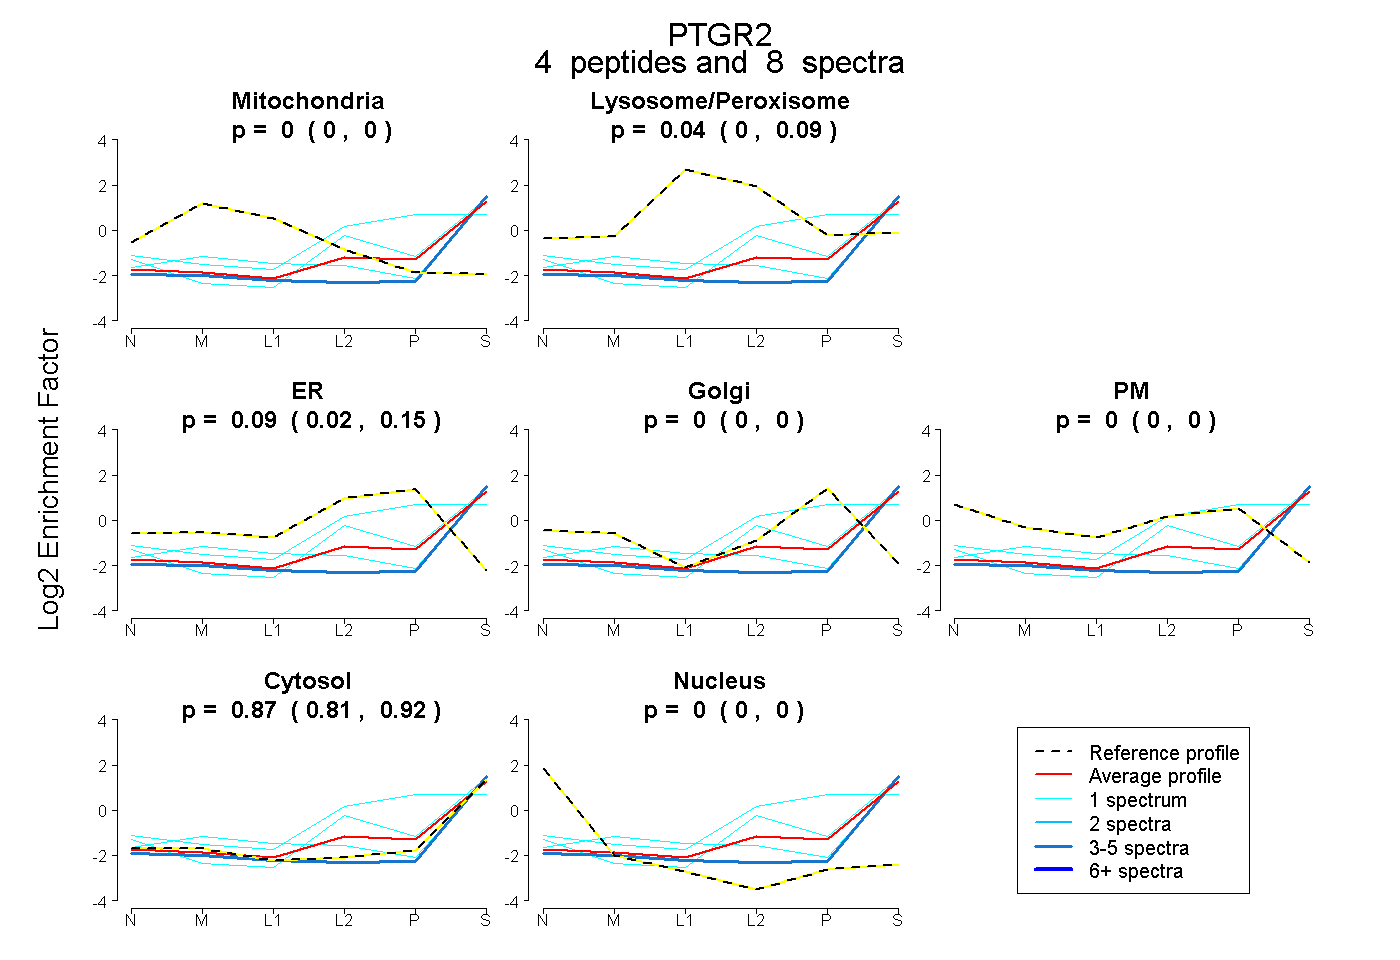
0.000 | 0.000
0.000 | 0.089
0.015 | 0.146
0.000 | 0.000
0.000 | 0.000
0.812 | 0.916
0.000 | 0.000
8peptides
spectra
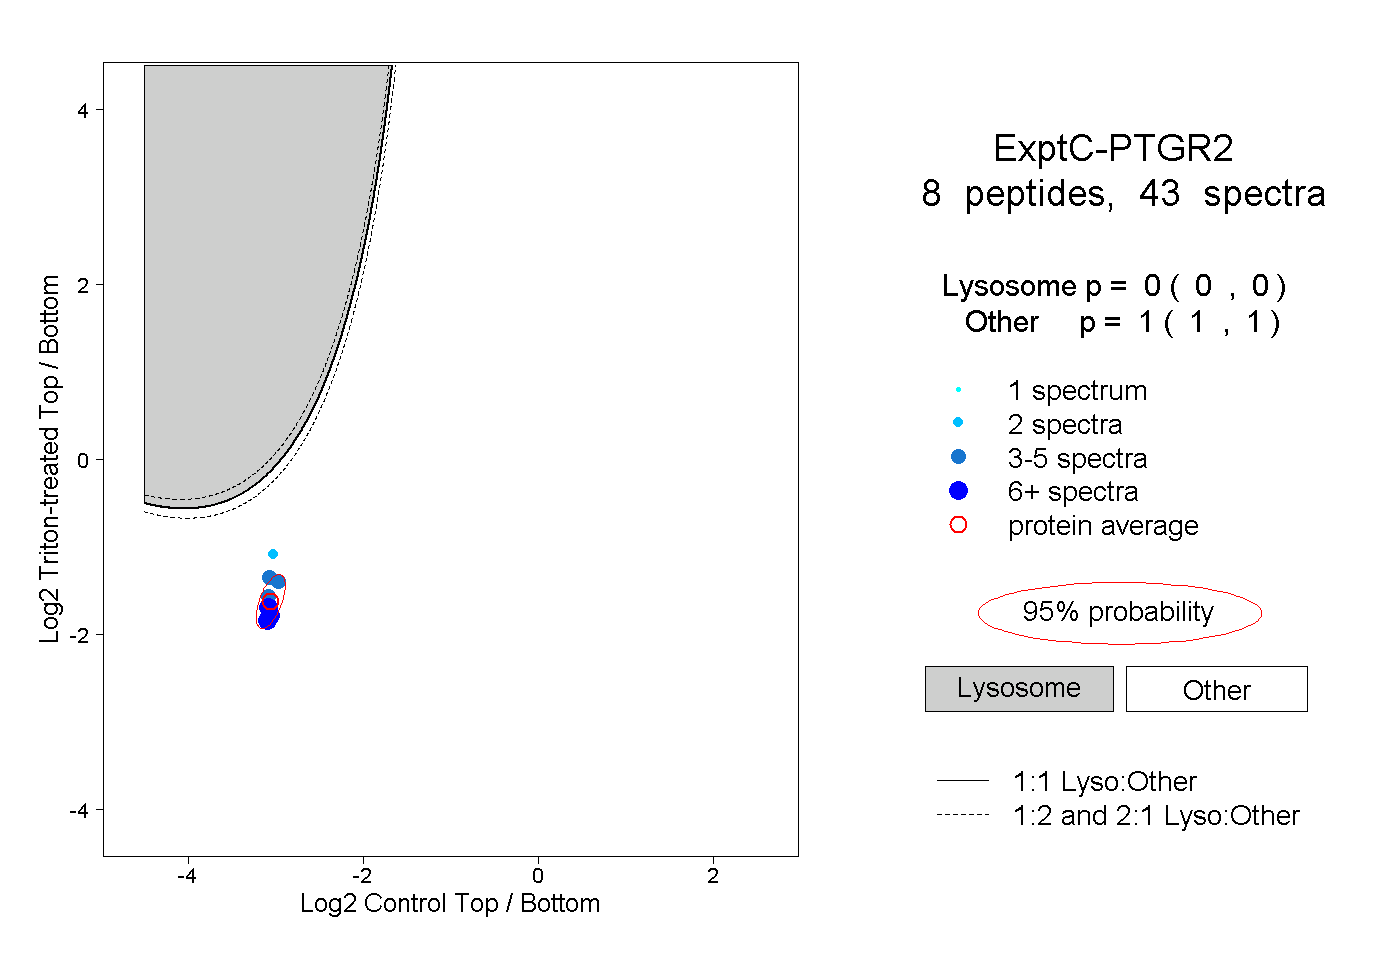
0.000 | 0.000
1.000 | 1.000
3peptides
spectra
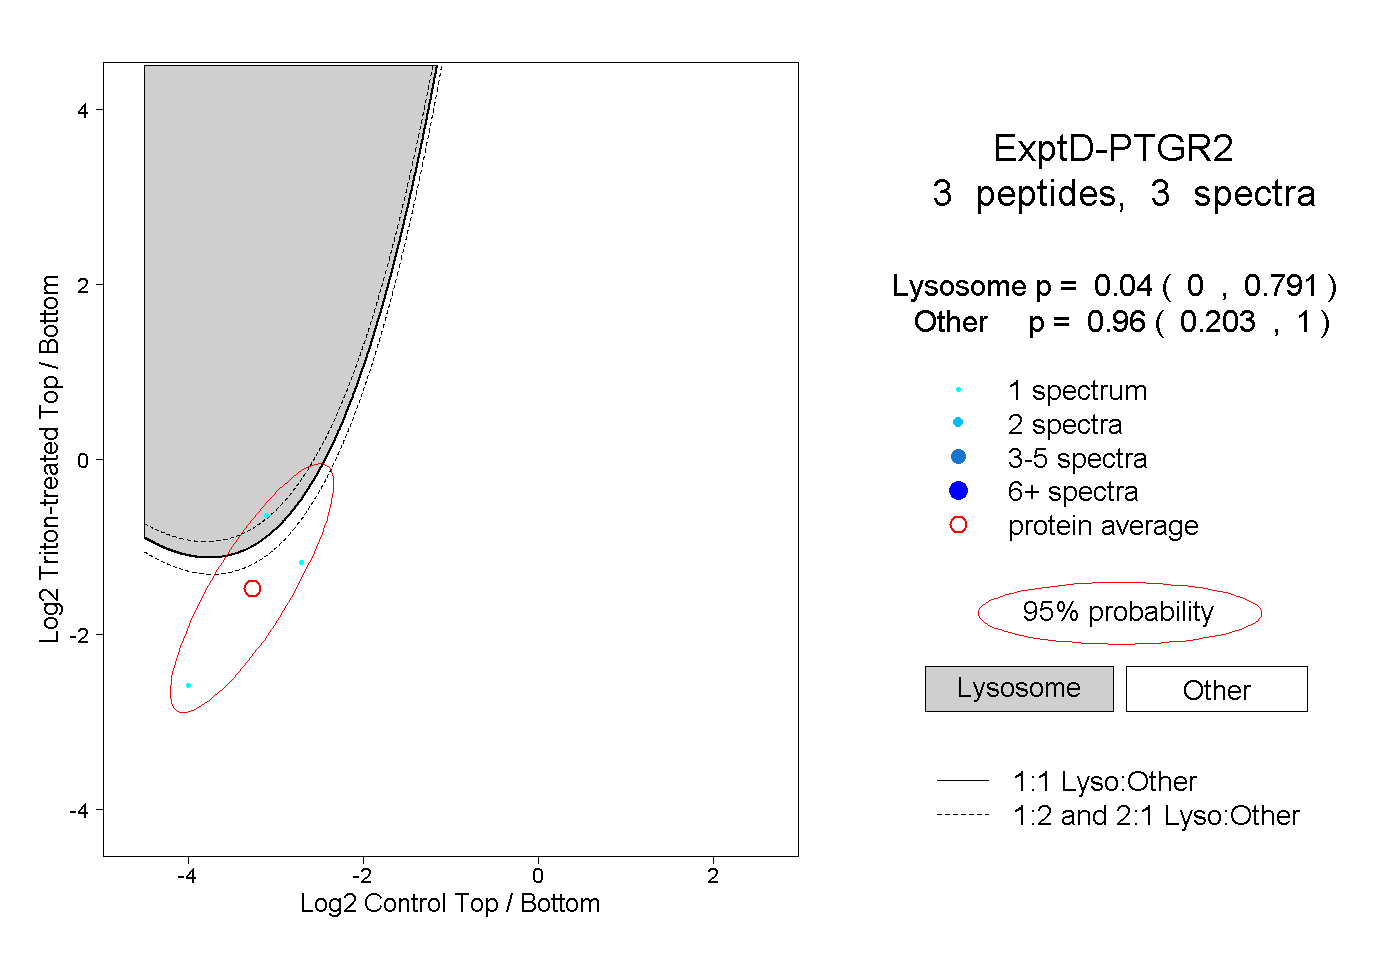
0.000 | 0.791
0.203 | 1.000