 11
11peptides
spectra
0.000 | 0.000
0.080 | 0.094
0.000 | 0.000
0.000 | 0.000
0.000 | 0.000
0.000 | 0.000
0.904 | 0.919
0.000 | 0.000
| Plot | Mito | Lyso | Perox | ER | Golgi | PM | Cytosol | Nucleus | |||||
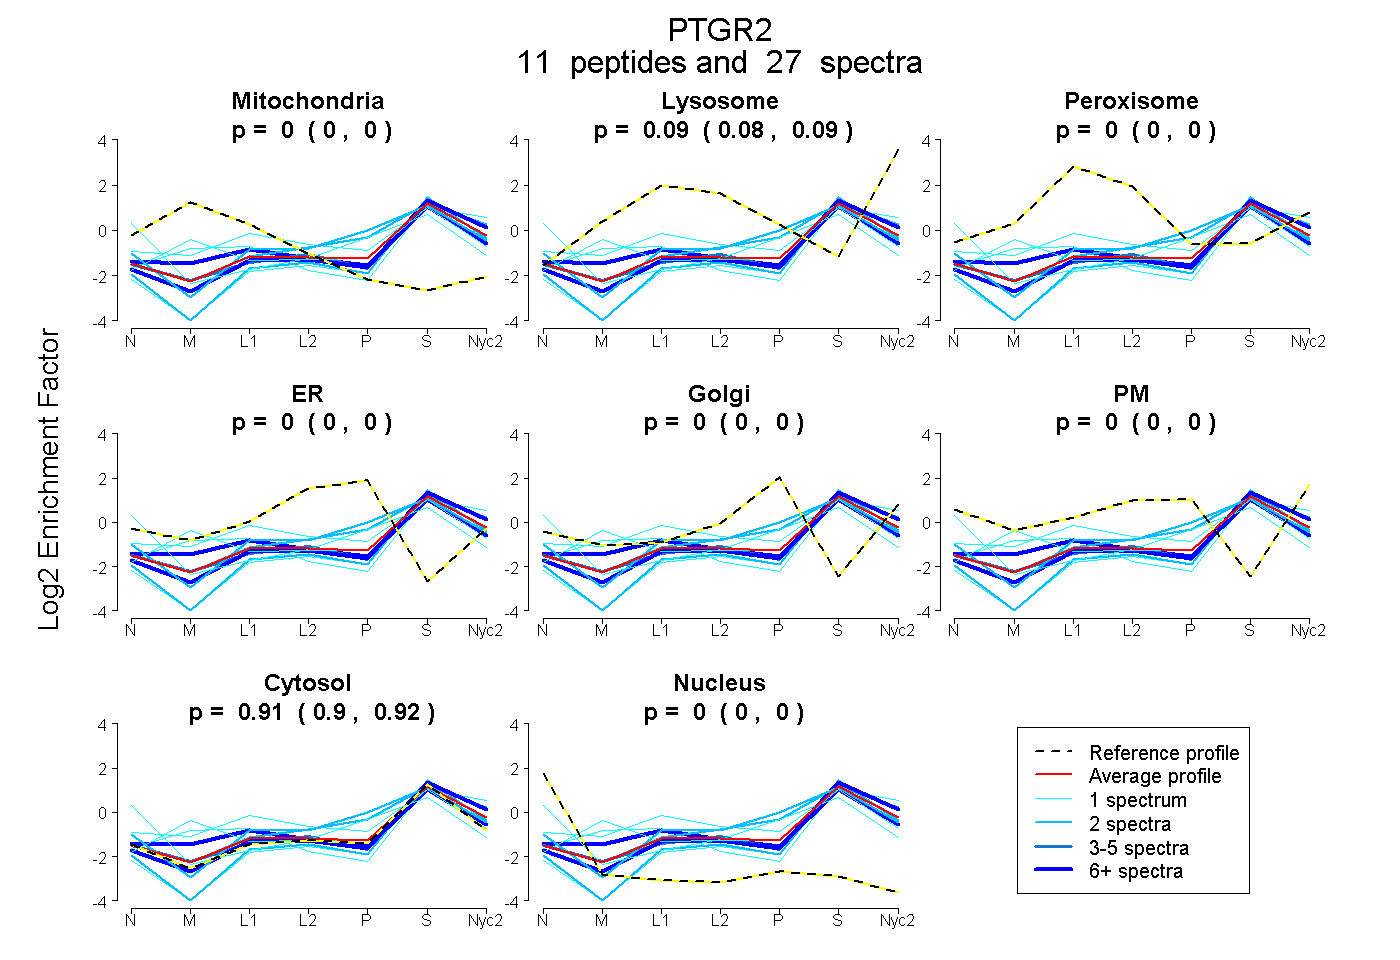
| Expt A |
11 peptides |
27 spectra |
|
0.000 0.000 | 0.000 |
0.087 0.080 | 0.094 |
0.000 0.000 | 0.000 |
0.000 0.000 | 0.000 |
0.000 0.000 | 0.000 |
0.000 0.000 | 0.000 |
0.913 0.904 | 0.919 |
0.000 0.000 | 0.000 |
| 1 spectrum, AILDGNGLEK | 0.000 | 0.000 | 0.000 | 0.000 | 0.000 | 0.000 | 1.000 | 0.000 | ||
| 1 spectrum, VVLDSRPGK | 0.197 | 0.073 | 0.000 | 0.000 | 0.000 | 0.000 | 0.729 | 0.000 | ||
| 2 spectra, VEEVSLPDTINEGQVR | 0.000 | 0.000 | 0.000 | 0.088 | 0.106 | 0.000 | 0.806 | 0.000 | ||
| 3 spectra, TGNVAEQLR | 0.000 | 0.093 | 0.000 | 0.000 | 0.000 | 0.000 | 0.907 | 0.000 | ||
| 1 spectrum, DVPYPPPLPPAVEAIQK | 0.201 | 0.041 | 0.000 | 0.000 | 0.000 | 0.000 | 0.759 | 0.000 | ||
| 1 spectrum, ISEDSSP | 0.000 | 0.226 | 0.115 | 0.000 | 0.000 | 0.000 | 0.660 | 0.000 | ||
| 6 spectra, FMVLNYK | 0.109 | 0.058 | 0.027 | 0.000 | 0.000 | 0.000 | 0.805 | 0.000 | ||
| 1 spectrum, VVGICGTHEK | 0.000 | 0.000 | 0.000 | 0.007 | 0.163 | 0.022 | 0.657 | 0.153 | ||
| 2 spectra, FEPGILQLSQWFK | 0.000 | 0.000 | 0.000 | 0.000 | 0.000 | 0.000 | 1.000 | 0.000 | ||
| 2 spectra, NGNPVAENFR | 0.000 | 0.130 | 0.000 | 0.000 | 0.083 | 0.000 | 0.787 | 0.000 | ||
| 7 spectra, TLYLSVDPYMR | 0.000 | 0.063 | 0.000 | 0.000 | 0.000 | 0.000 | 0.937 | 0.000 |
| Plot | Mito | Lyso or Perox | ER | Golgi | PM | Cytosol | Nucleus | ||||||
| Expt B |
4 peptides |
8 spectra |
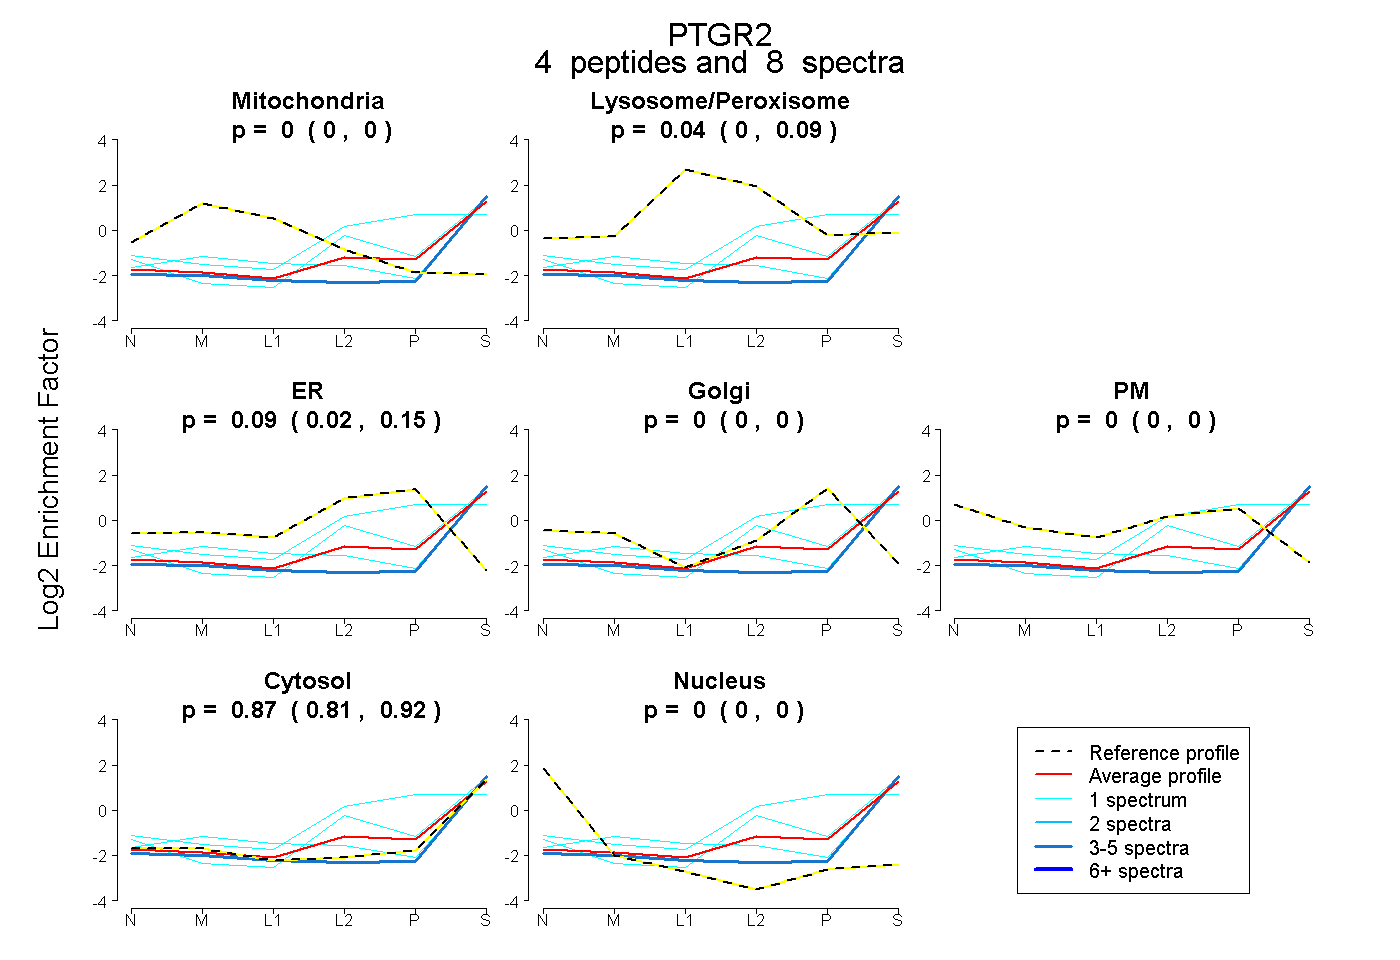 |
0.000 0.000 | 0.000 |
0.039 0.000 | 0.089 |
0.089 0.015 | 0.146 |
0.000 0.000 | 0.000 |
0.000 0.000 | 0.000 |
0.872 0.812 | 0.916 |
0.000 0.000 | 0.000 |
|||
| Plot | Lyso | Other | |||||||||||
| Expt C |
8 peptides |
43 spectra |
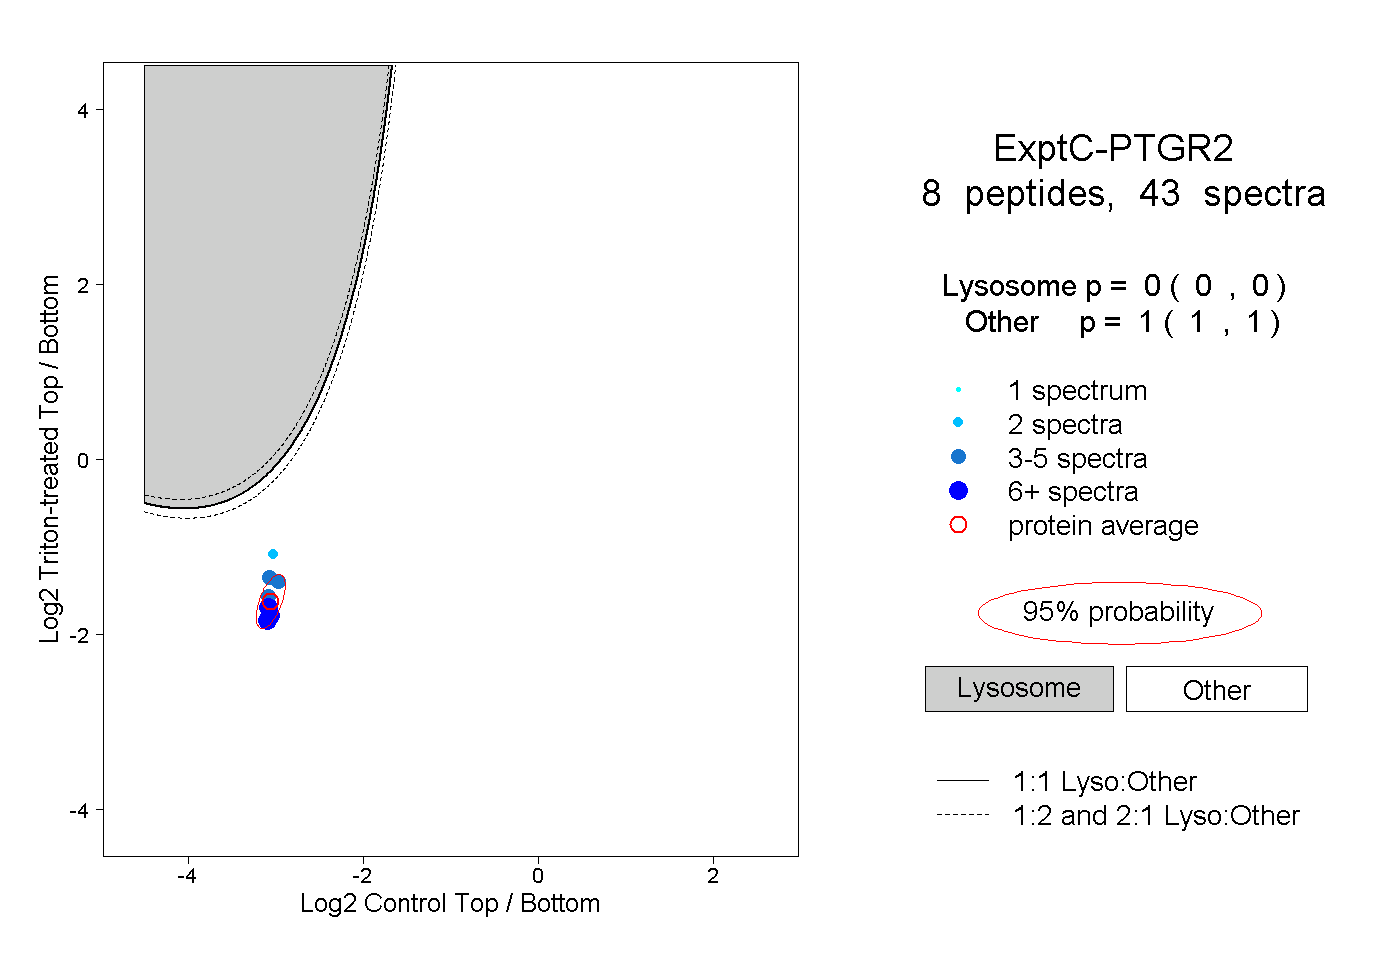 |
0.000 0.000 | 0.000 |
1.000 1.000 | 1.000 |
||||||||
| Plot | Lyso | Other | |||||||||||
| Expt D |
3 peptides |
3 spectra |
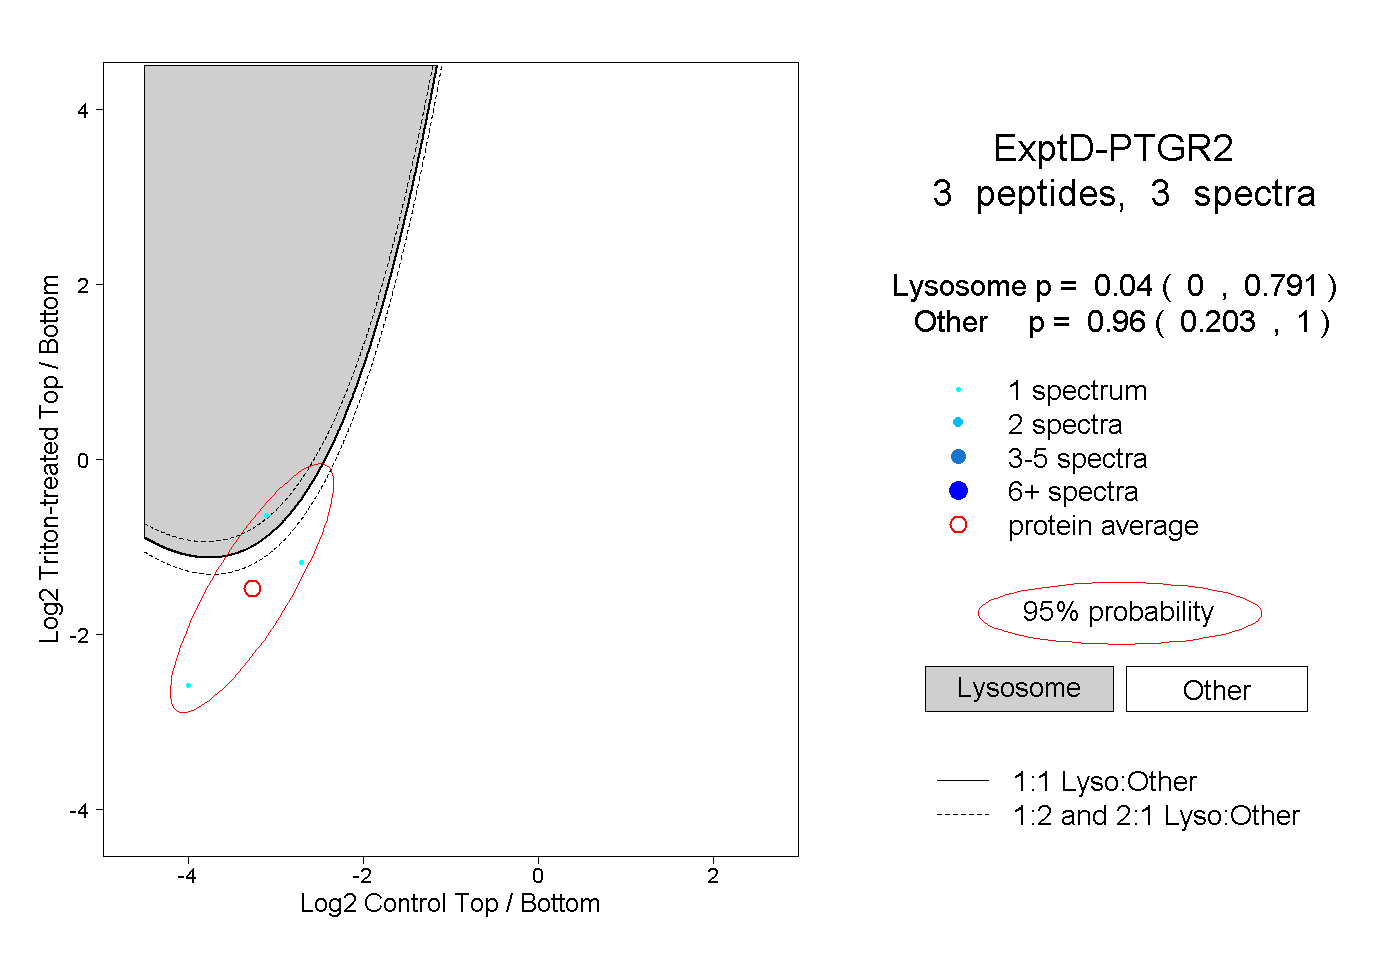 |
0.040 0.000 | 0.791 |
0.960 0.203 | 1.000 |