 21
21peptides
spectra
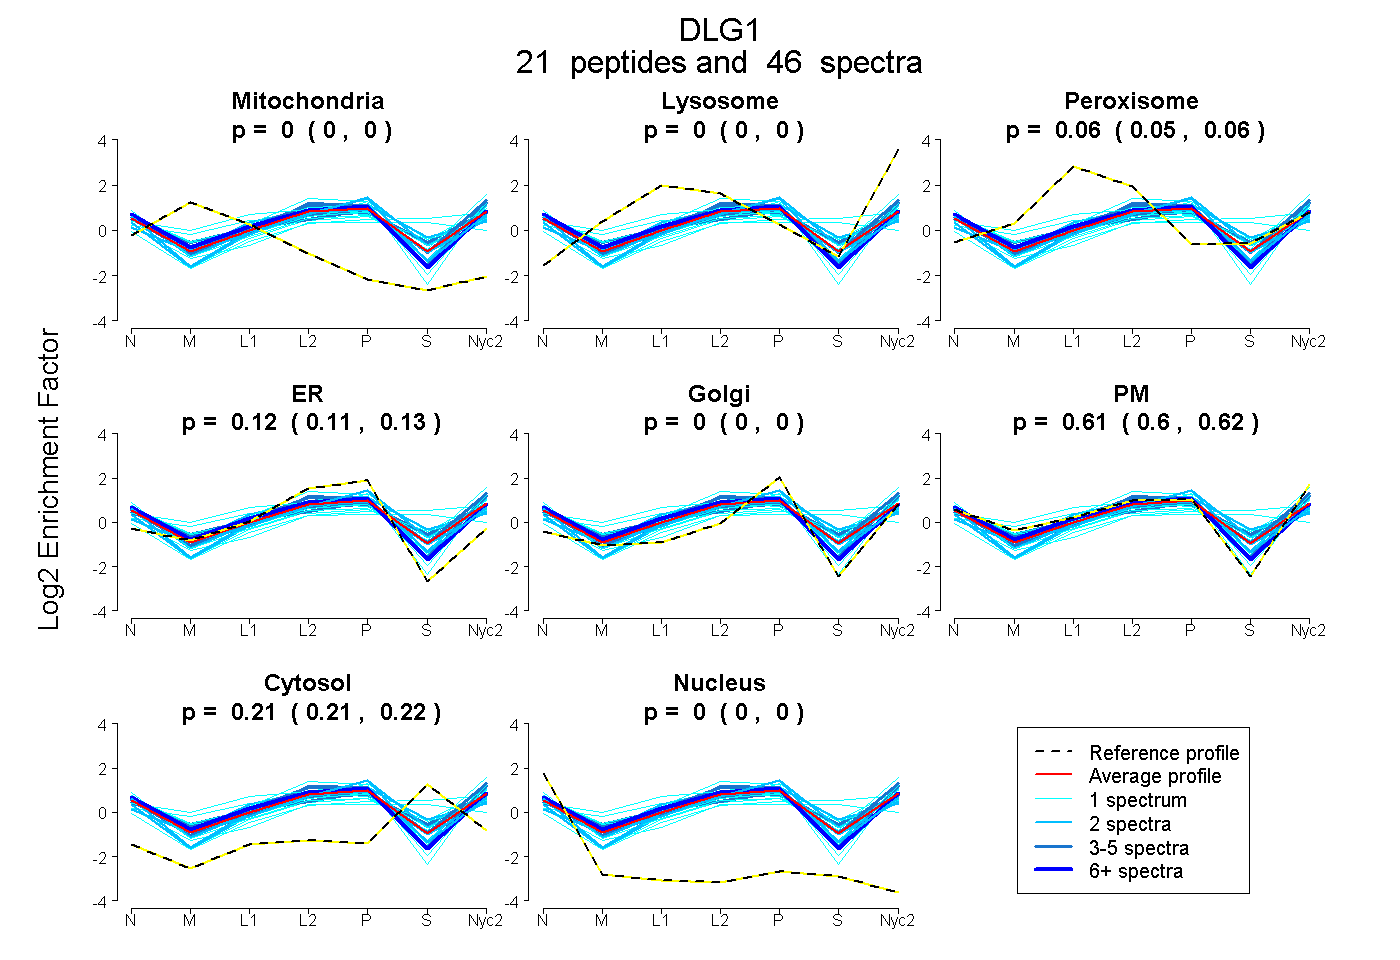
0.000 | 0.000
0.000 | 0.000
0.051 | 0.062
0.109 | 0.126
0.000 | 0.000
0.603 | 0.621
0.208 | 0.216
0.000 | 0.000
6peptides
spectra
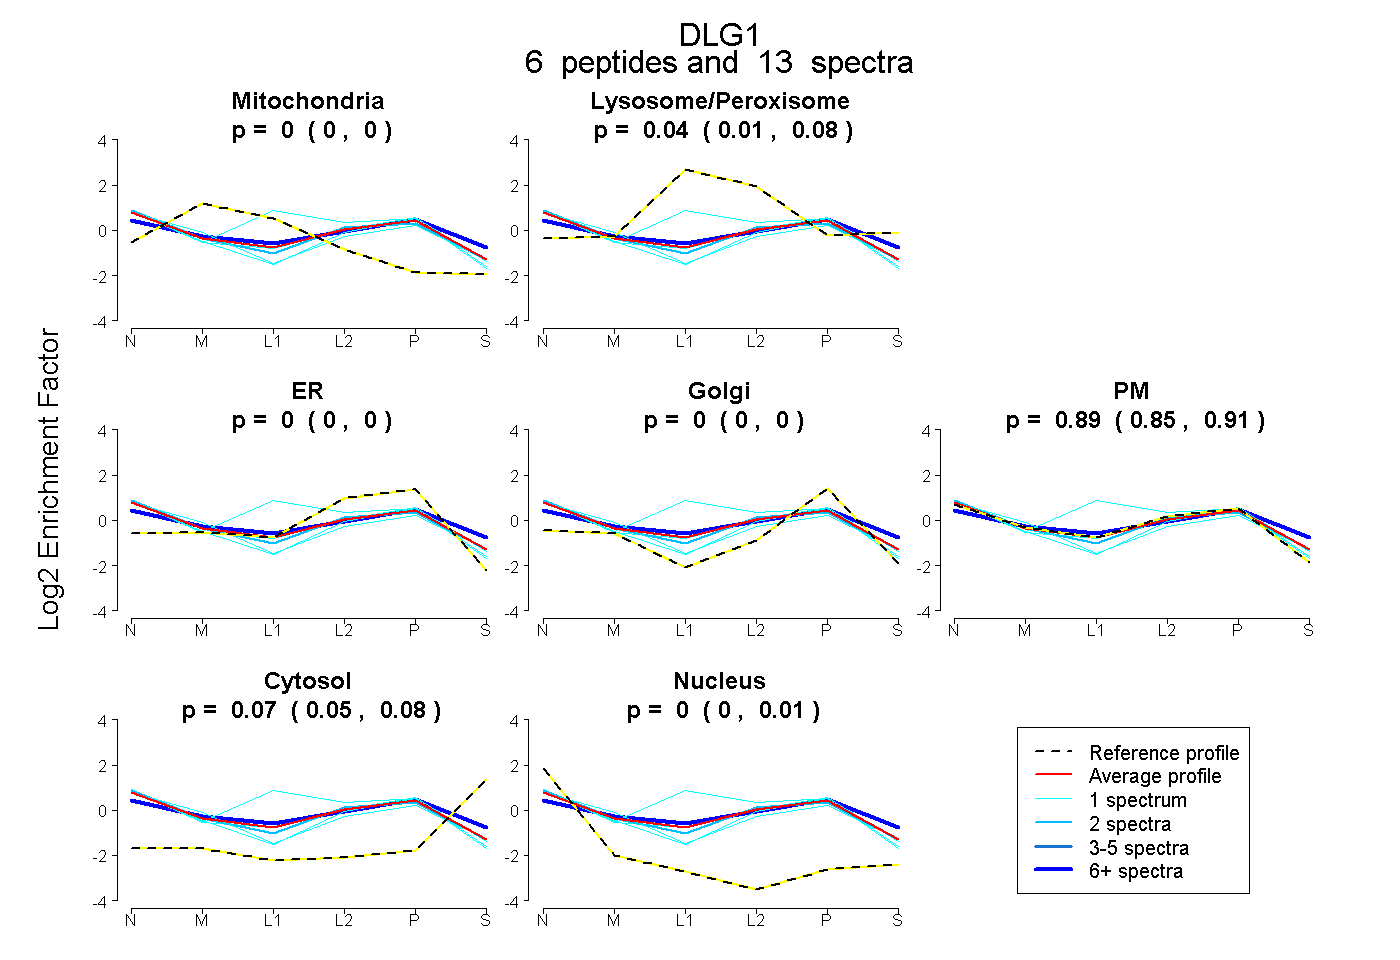
0.000 | 0.000
0.008 | 0.076
0.000 | 0.000
0.000 | 0.000
0.847 | 0.911
0.050 | 0.083
0.000 | 0.012
23peptides
spectra
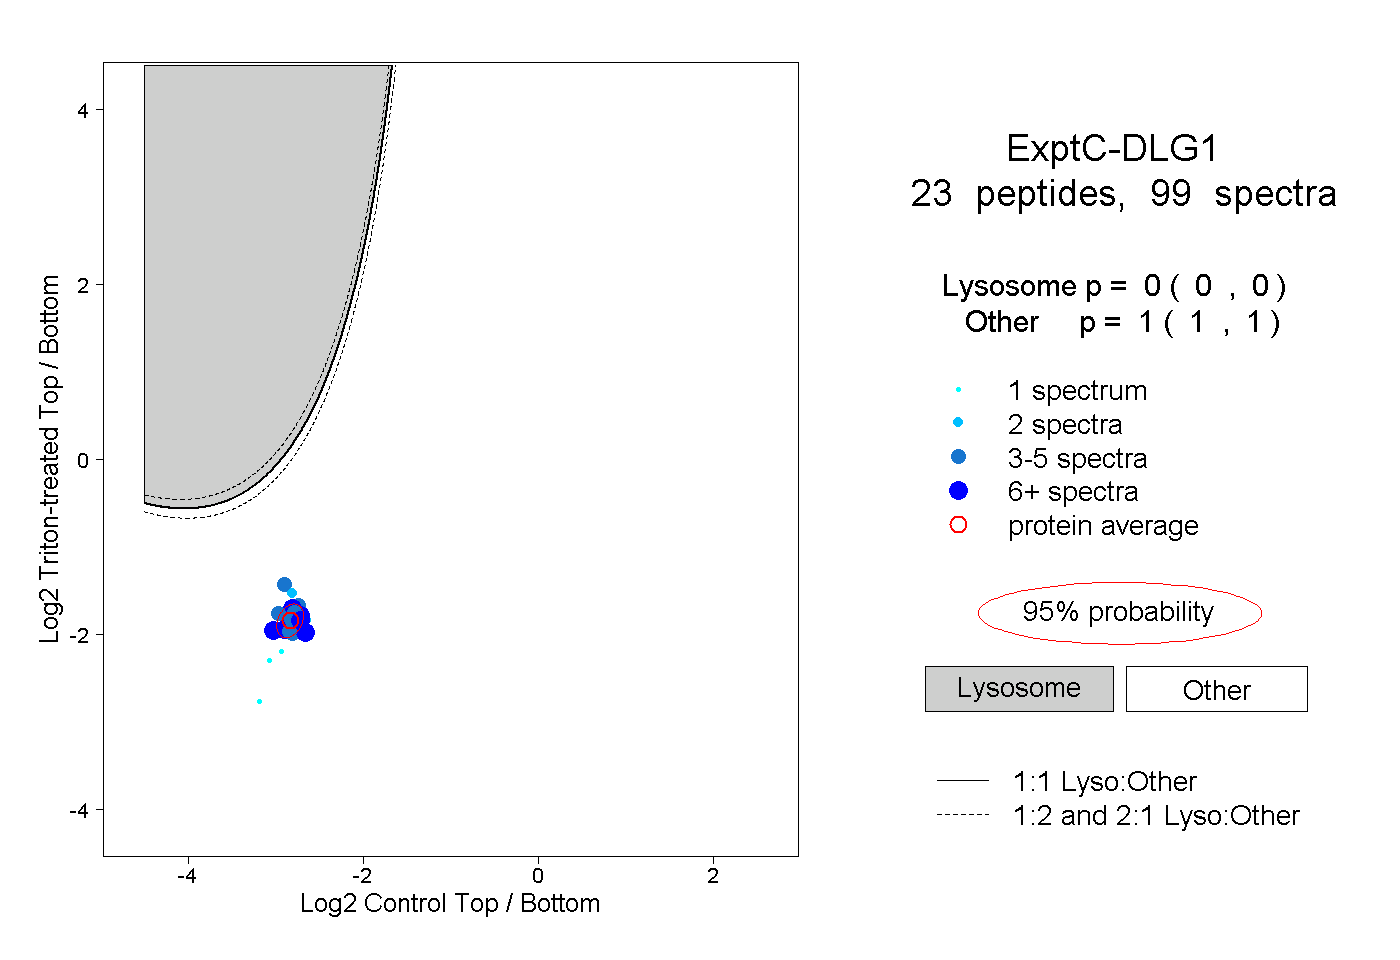
0.000 | 0.000
1.000 | 1.000
9peptides
spectra
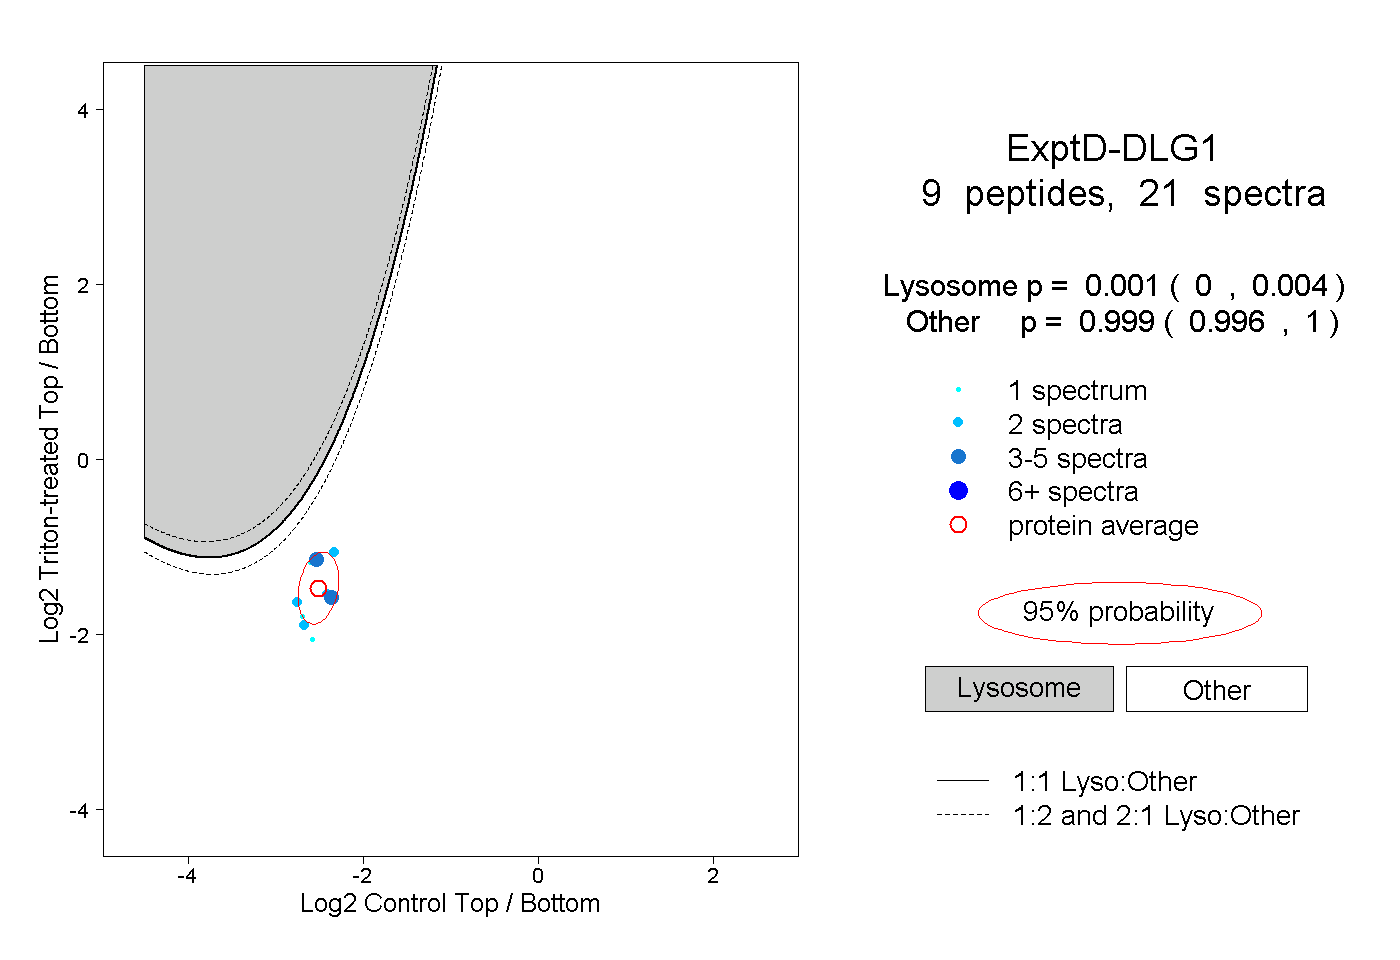
0.000 | 0.004
0.996 | 1.000