 21
21peptides
spectra
0.000 | 0.000
0.000 | 0.000
0.051 | 0.062
0.109 | 0.126
0.000 | 0.000
0.603 | 0.621
0.208 | 0.216
0.000 | 0.000
| Plot | Mito | Lyso | Perox | ER | Golgi | PM | Cytosol | Nucleus | |||||
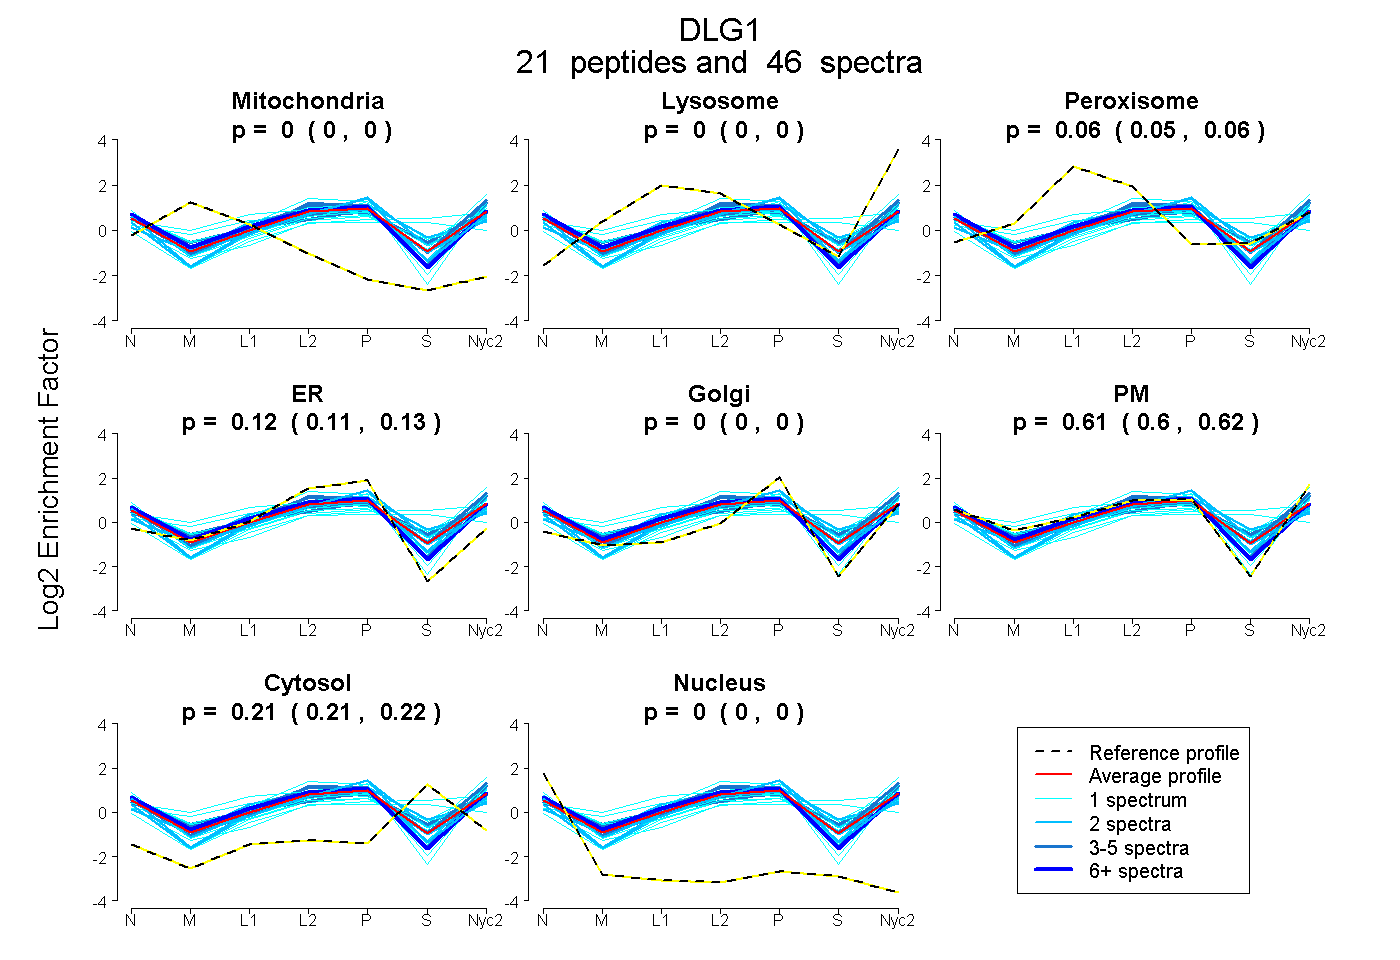
| Expt A |
21 peptides |
46 spectra |
|
0.000 0.000 | 0.000 |
0.000 0.000 | 0.000 |
0.057 0.051 | 0.062 |
0.118 0.109 | 0.126 |
0.000 0.000 | 0.000 |
0.613 0.603 | 0.621 |
0.212 0.208 | 0.216 |
0.000 0.000 | 0.000 |
| 1 spectrum, NAGQAVTIVAQYRPEEYSR | 0.000 | 0.000 | 0.001 | 0.205 | 0.000 | 0.794 | 0.000 | 0.000 | ||
| 1 spectrum, DYEVDGR | 0.000 | 0.077 | 0.008 | 0.000 | 0.000 | 0.413 | 0.501 | 0.000 | ||
| 1 spectrum, SMENIMEMNK | 0.000 | 0.000 | 0.267 | 0.000 | 0.055 | 0.621 | 0.057 | 0.000 | ||
| 4 spectra, ALFDYDK | 0.000 | 0.000 | 0.071 | 0.036 | 0.000 | 0.619 | 0.274 | 0.000 | ||
| 1 spectrum, FGDILHVINASDDEWWQAR | 0.000 | 0.000 | 0.100 | 0.157 | 0.000 | 0.525 | 0.193 | 0.025 | ||
| 10 spectra, YQDEEVLPSER | 0.000 | 0.000 | 0.049 | 0.180 | 0.000 | 0.651 | 0.105 | 0.015 | ||
| 1 spectrum, VNDDLISEFPDK | 0.000 | 0.000 | 0.022 | 0.160 | 0.000 | 0.749 | 0.058 | 0.010 | ||
| 2 spectra, YSLPSK | 0.000 | 0.000 | 0.000 | 0.271 | 0.060 | 0.490 | 0.179 | 0.000 | ||
| 1 spectrum, ALHLLEEYR | 0.000 | 0.017 | 0.245 | 0.000 | 0.028 | 0.481 | 0.229 | 0.000 | ||
| 4 spectra, EAGSIVR | 0.000 | 0.000 | 0.117 | 0.047 | 0.070 | 0.564 | 0.202 | 0.000 | ||
| 1 spectrum, AASHEQAAAALK | 0.000 | 0.000 | 0.062 | 0.129 | 0.000 | 0.313 | 0.495 | 0.000 | ||
| 4 spectra, IITGGAAAQDGR | 0.000 | 0.000 | 0.001 | 0.101 | 0.000 | 0.789 | 0.109 | 0.000 | ||
| 2 spectra, GEIPDDMGSK | 0.000 | 0.000 | 0.231 | 0.260 | 0.055 | 0.224 | 0.230 | 0.000 | ||
| 1 spectrum, LQIGDK | 0.000 | 0.000 | 0.049 | 0.116 | 0.000 | 0.561 | 0.274 | 0.000 | ||
| 2 spectra, VNDCILR | 0.000 | 0.000 | 0.031 | 0.196 | 0.000 | 0.544 | 0.228 | 0.000 | ||
| 2 spectra, DVTHSK | 0.000 | 0.000 | 0.000 | 0.282 | 0.032 | 0.415 | 0.271 | 0.000 | ||
| 1 spectrum, AVLGDDEITR | 0.000 | 0.000 | 0.000 | 0.248 | 0.060 | 0.363 | 0.329 | 0.000 | ||
| 1 spectrum, LTDEQAR | 0.000 | 0.000 | 0.000 | 0.000 | 0.000 | 0.758 | 0.242 | 0.000 | ||
| 1 spectrum, DIQEHK | 0.000 | 0.000 | 0.029 | 0.153 | 0.000 | 0.694 | 0.124 | 0.000 | ||
| 3 spectra, NTSDFVYLK | 0.000 | 0.000 | 0.108 | 0.002 | 0.000 | 0.732 | 0.158 | 0.000 | ||
| 2 spectra, IISVNSVDLR | 0.000 | 0.000 | 0.005 | 0.116 | 0.000 | 0.726 | 0.152 | 0.000 |
| Plot | Mito | Lyso or Perox | ER | Golgi | PM | Cytosol | Nucleus | ||||||
| Expt B |
6 peptides |
13 spectra |
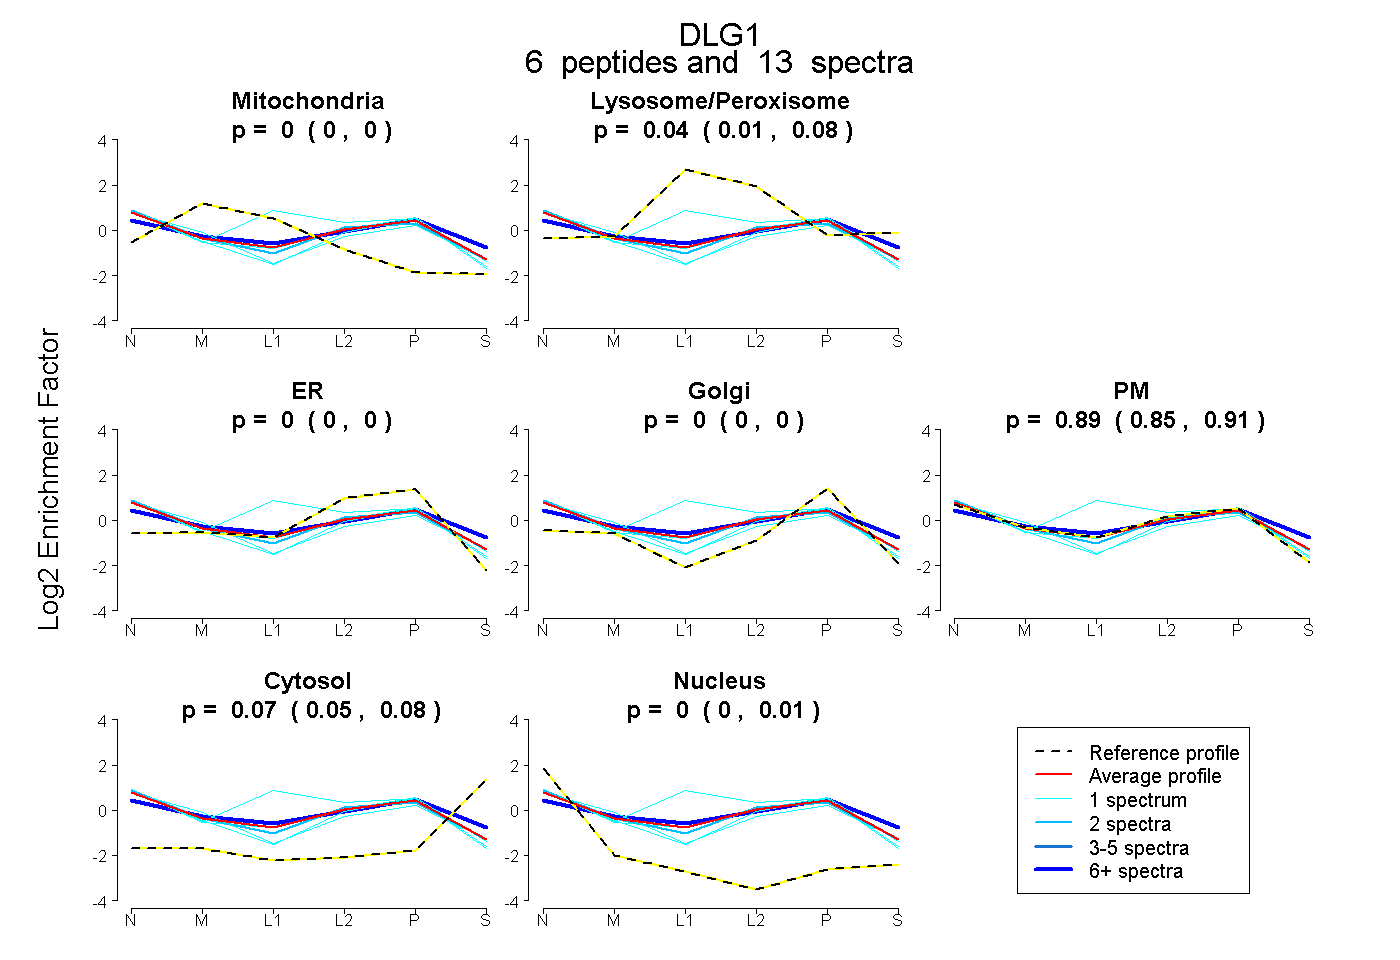 |
0.000 0.000 | 0.000 |
0.042 0.008 | 0.076 |
0.000 0.000 | 0.000 |
0.000 0.000 | 0.000 |
0.887 0.847 | 0.911 |
0.071 0.050 | 0.083 |
0.000 0.000 | 0.012 |
|||
| Plot | Lyso | Other | |||||||||||
| Expt C |
23 peptides |
99 spectra |
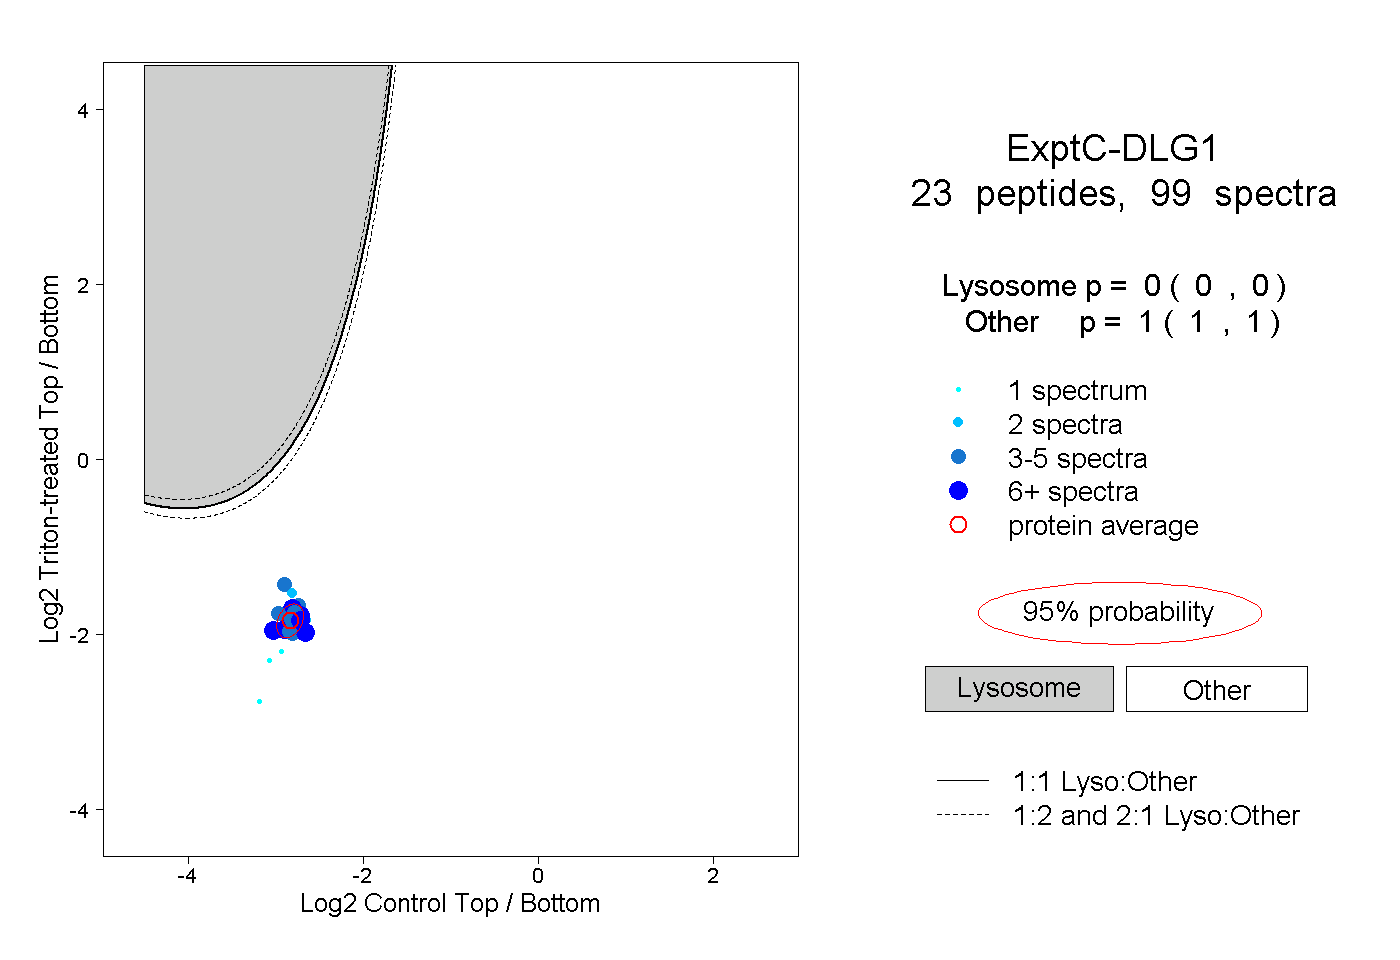 |
0.000 0.000 | 0.000 |
1.000 1.000 | 1.000 |
||||||||
| Plot | Lyso | Other | |||||||||||
| Expt D |
9 peptides |
21 spectra |
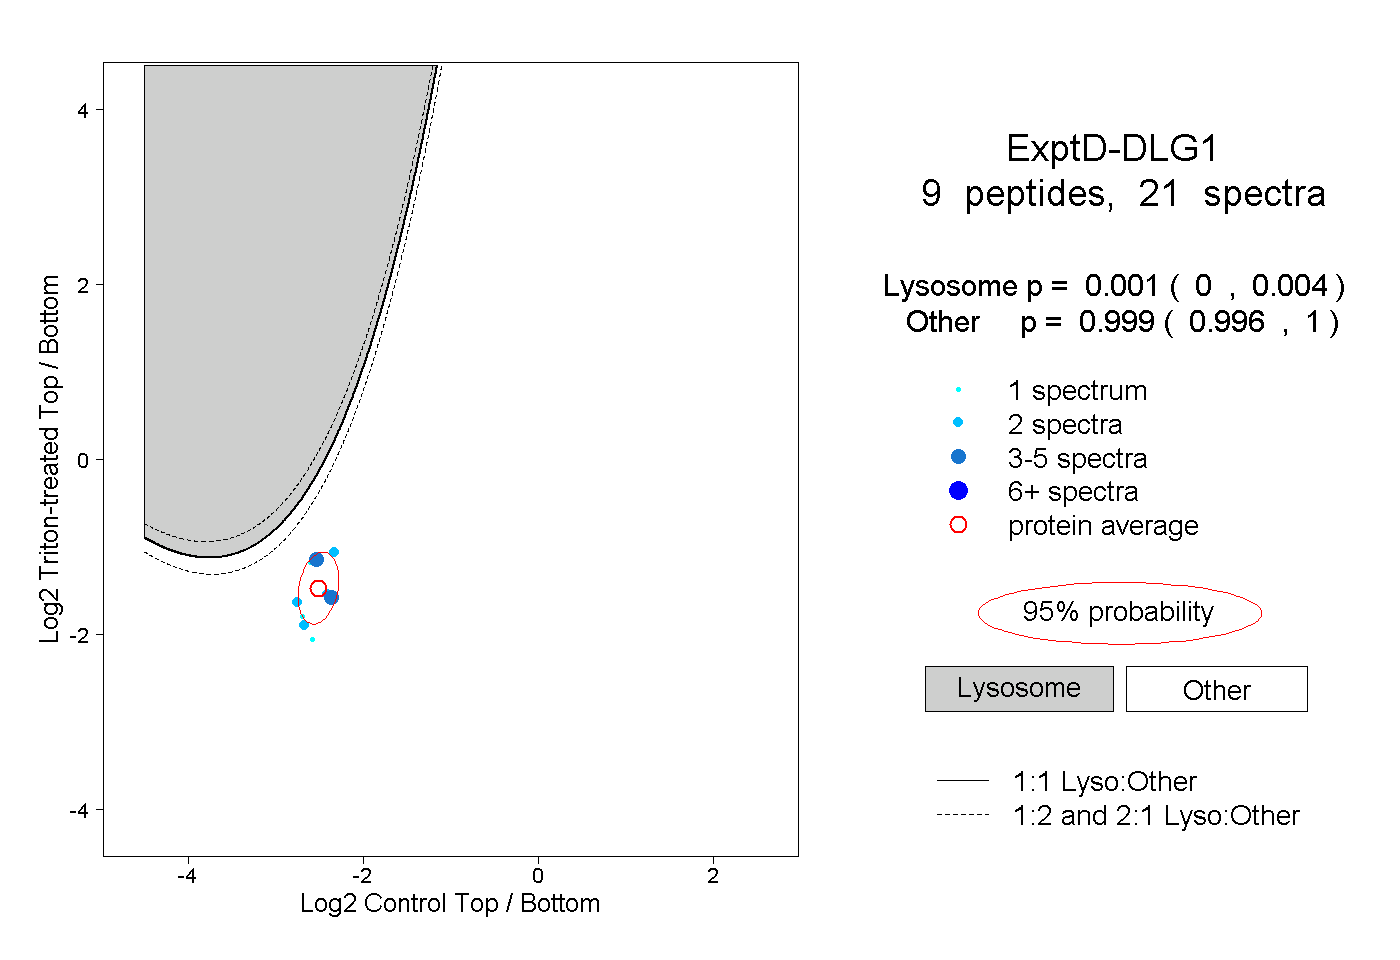 |
0.001 0.000 | 0.004 |
0.999 0.996 | 1.000 |