 14
14peptides
spectra
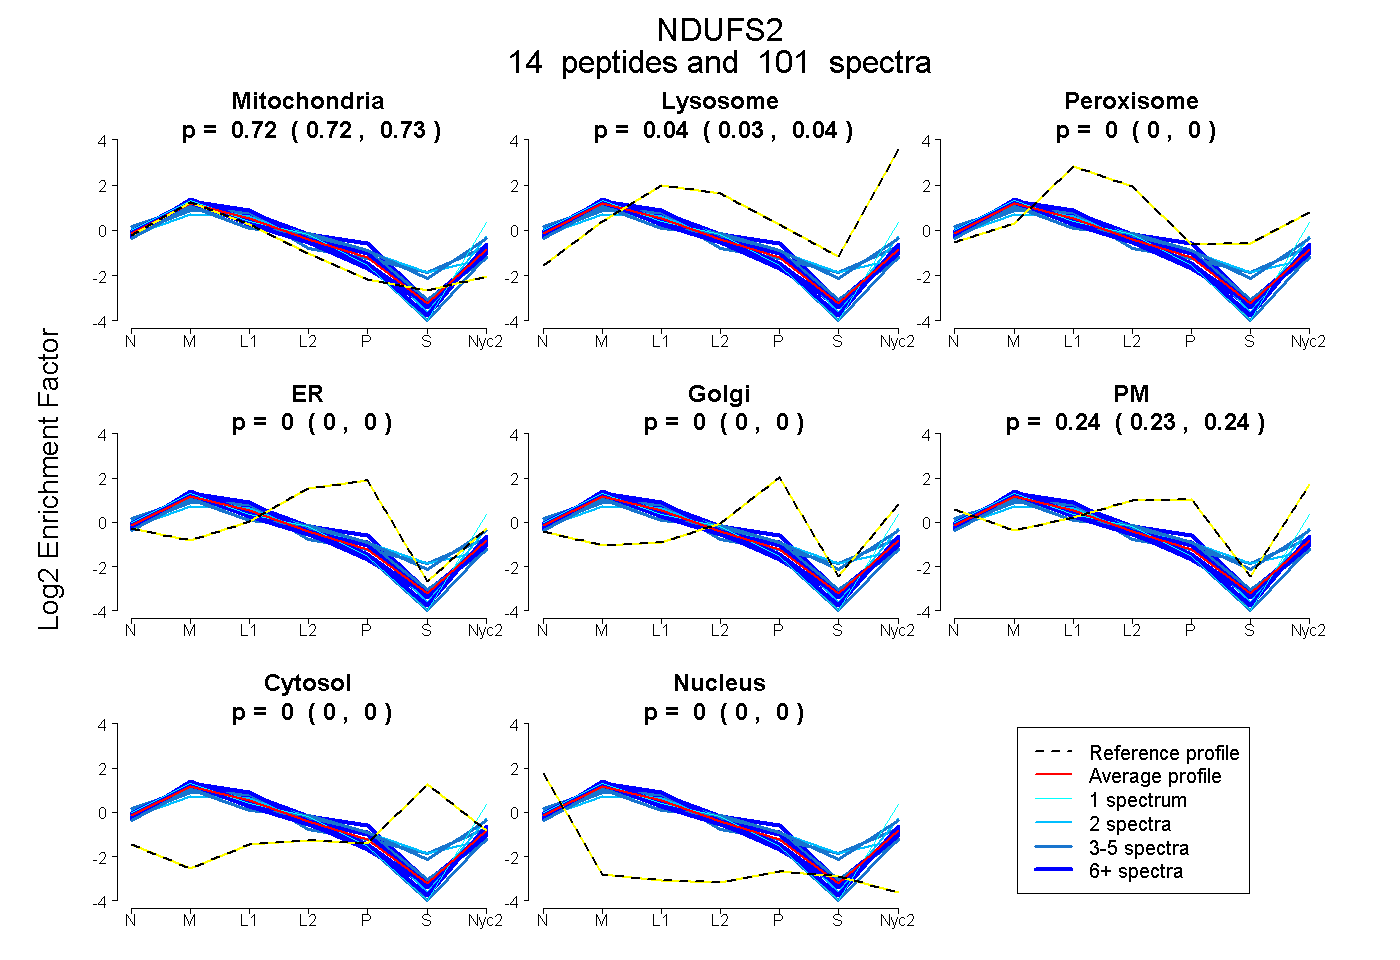
0.722 | 0.727
0.034 | 0.040
0.000 | 0.000
0.000 | 0.000
0.000 | 0.000
0.234 | 0.242
0.000 | 0.000
0.000 | 0.000
14peptides
spectra
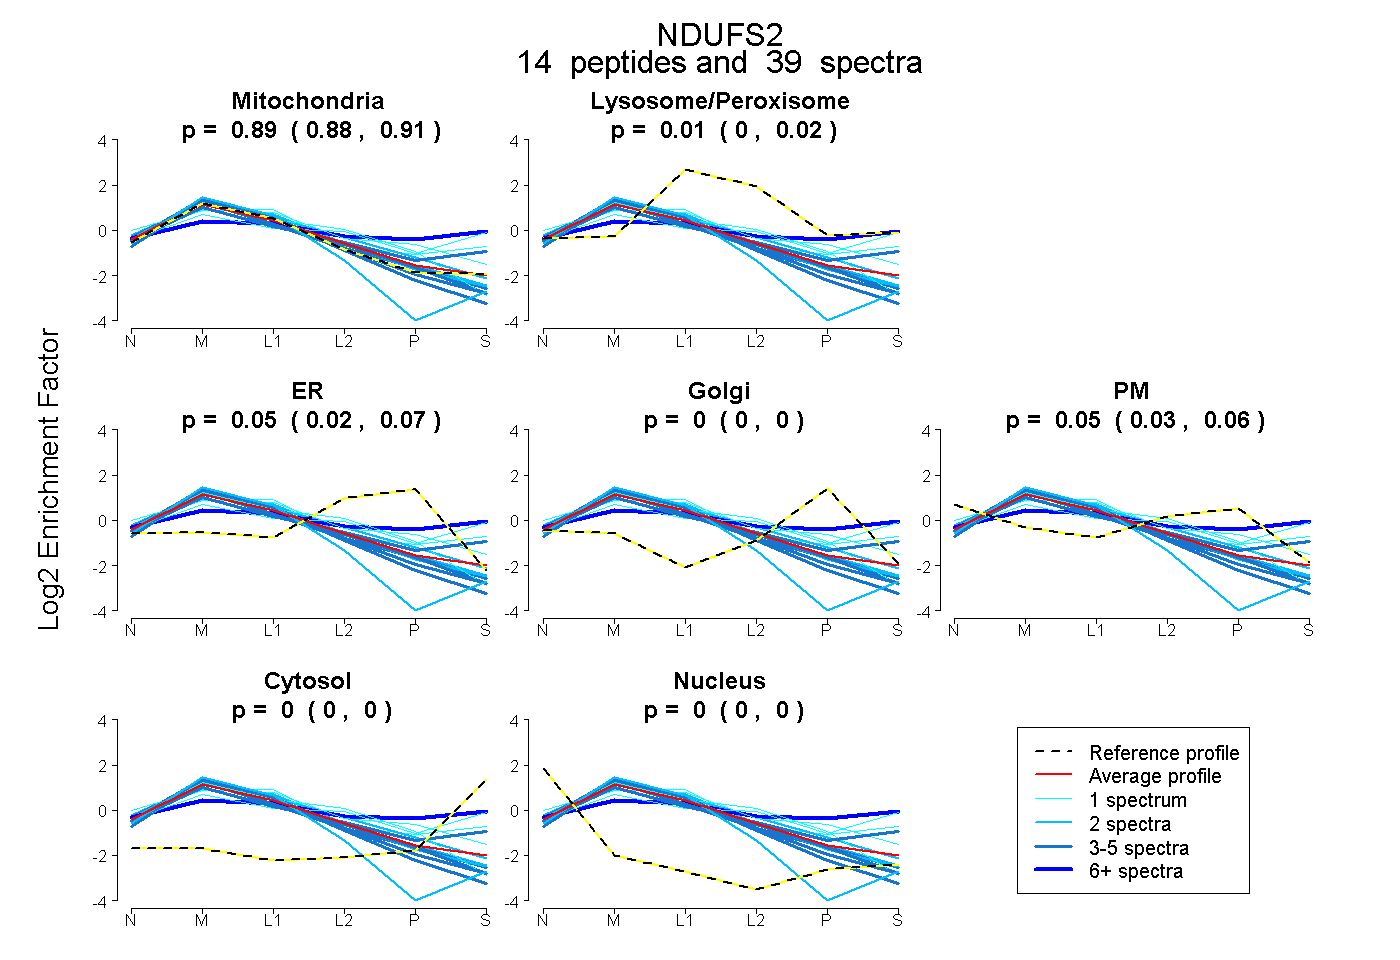
0.876 | 0.905
0.000 | 0.021
0.025 | 0.072
0.000 | 0.000
0.029 | 0.064
0.000 | 0.000
0.000 | 0.000
16peptides
spectra
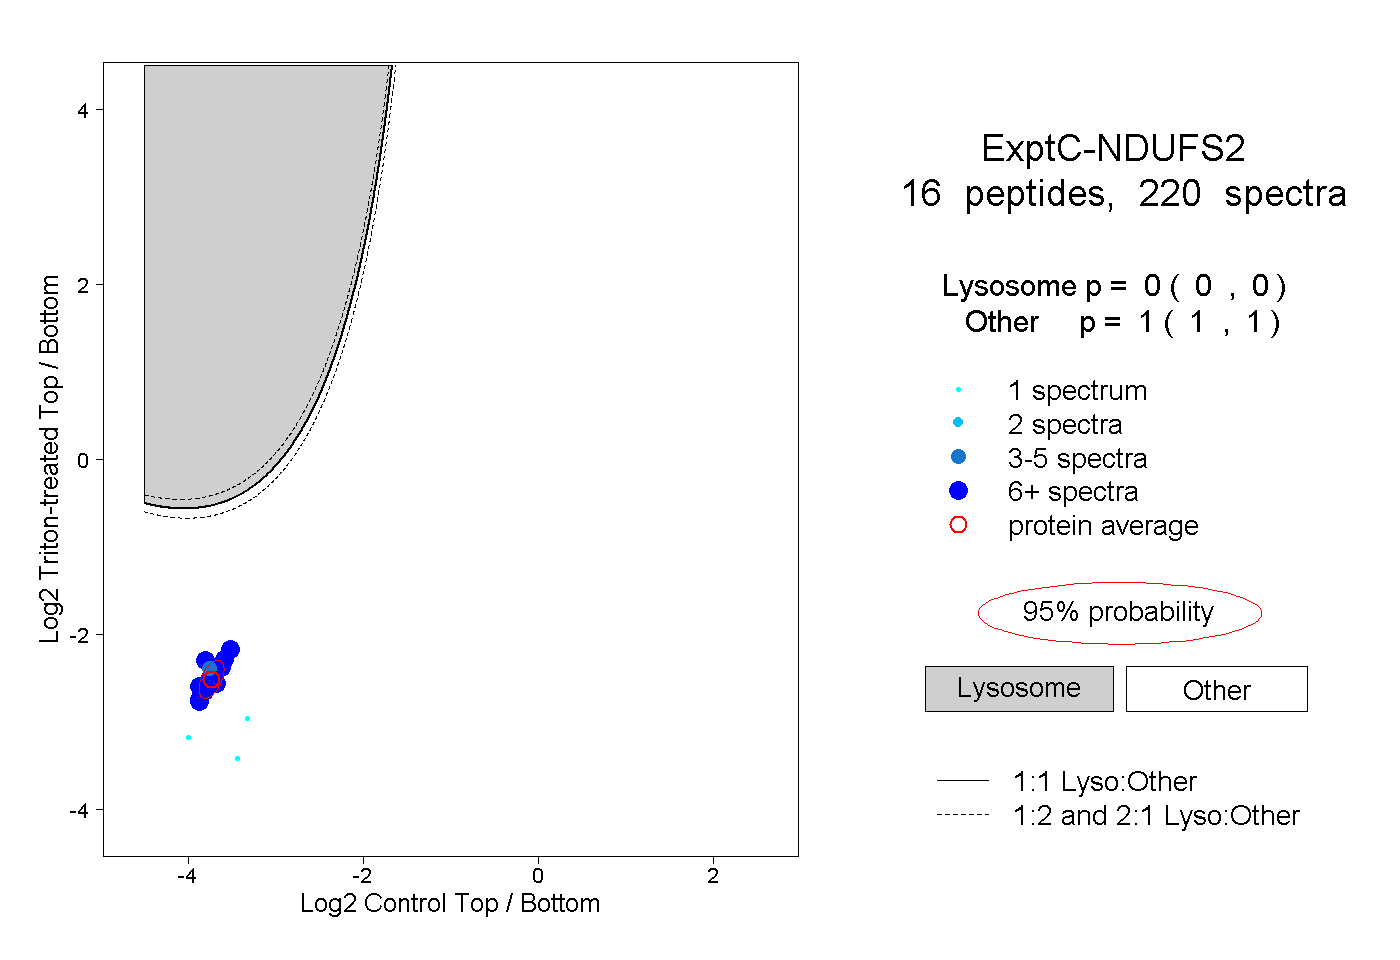
0.000 | 0.000
1.000 | 1.000
8peptides
spectra
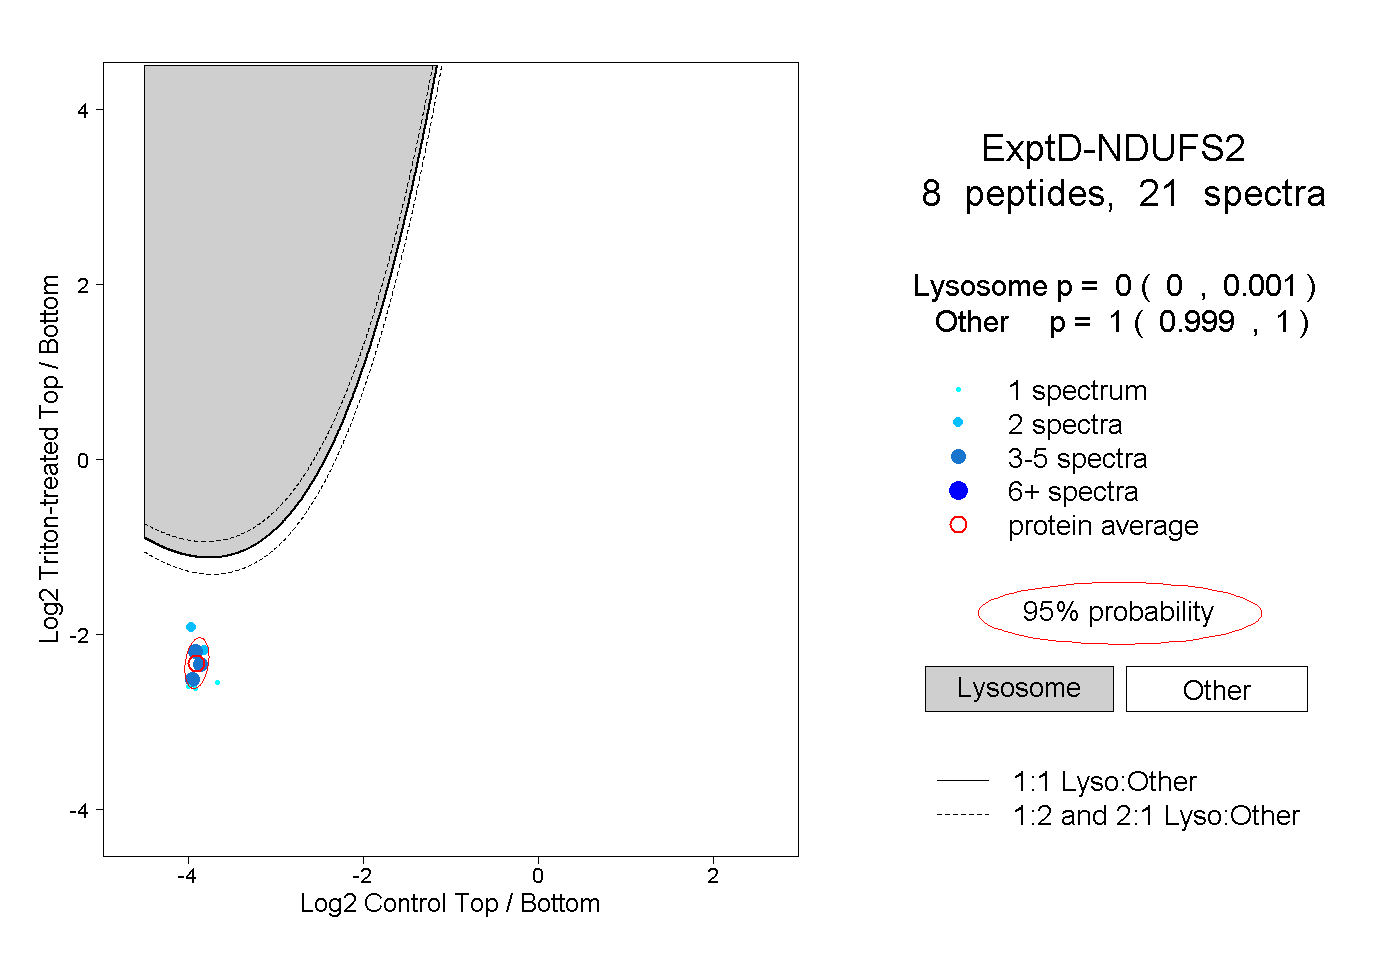
0.000 | 0.001
0.999 | 1.000