 9
9peptides
spectra
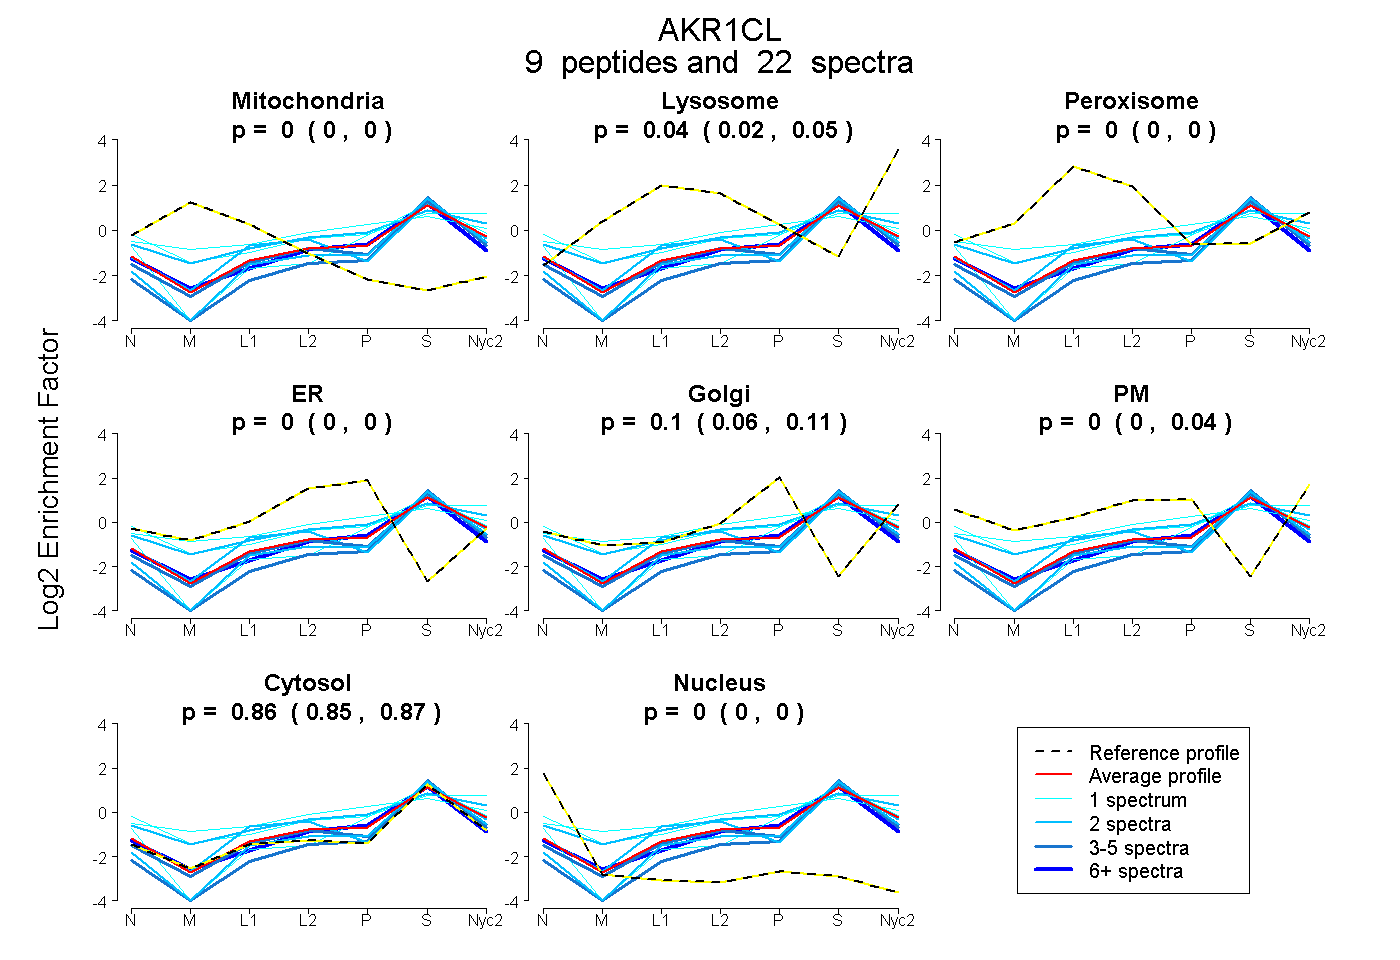
0.000 | 0.000
0.015 | 0.050
0.000 | 0.000
0.000 | 0.002
0.058 | 0.113
0.000 | 0.042
0.849 | 0.874
0.000 | 0.000
1peptide
spectra
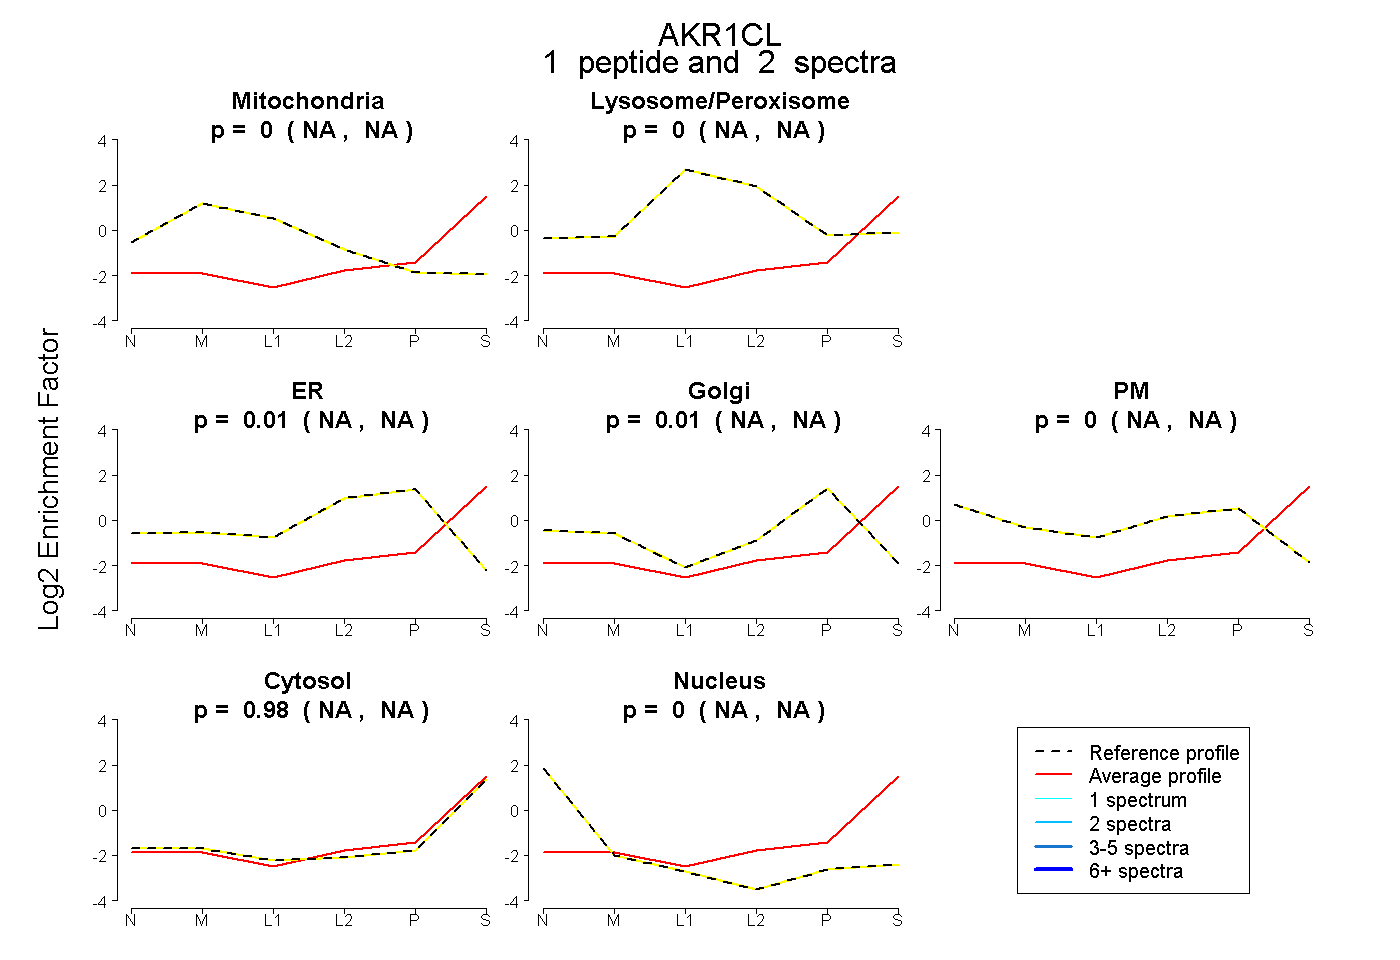
NA | NA
NA | NA
NA | NA
NA | NA
NA | NA
NA | NA
NA | NA
12peptides
spectra
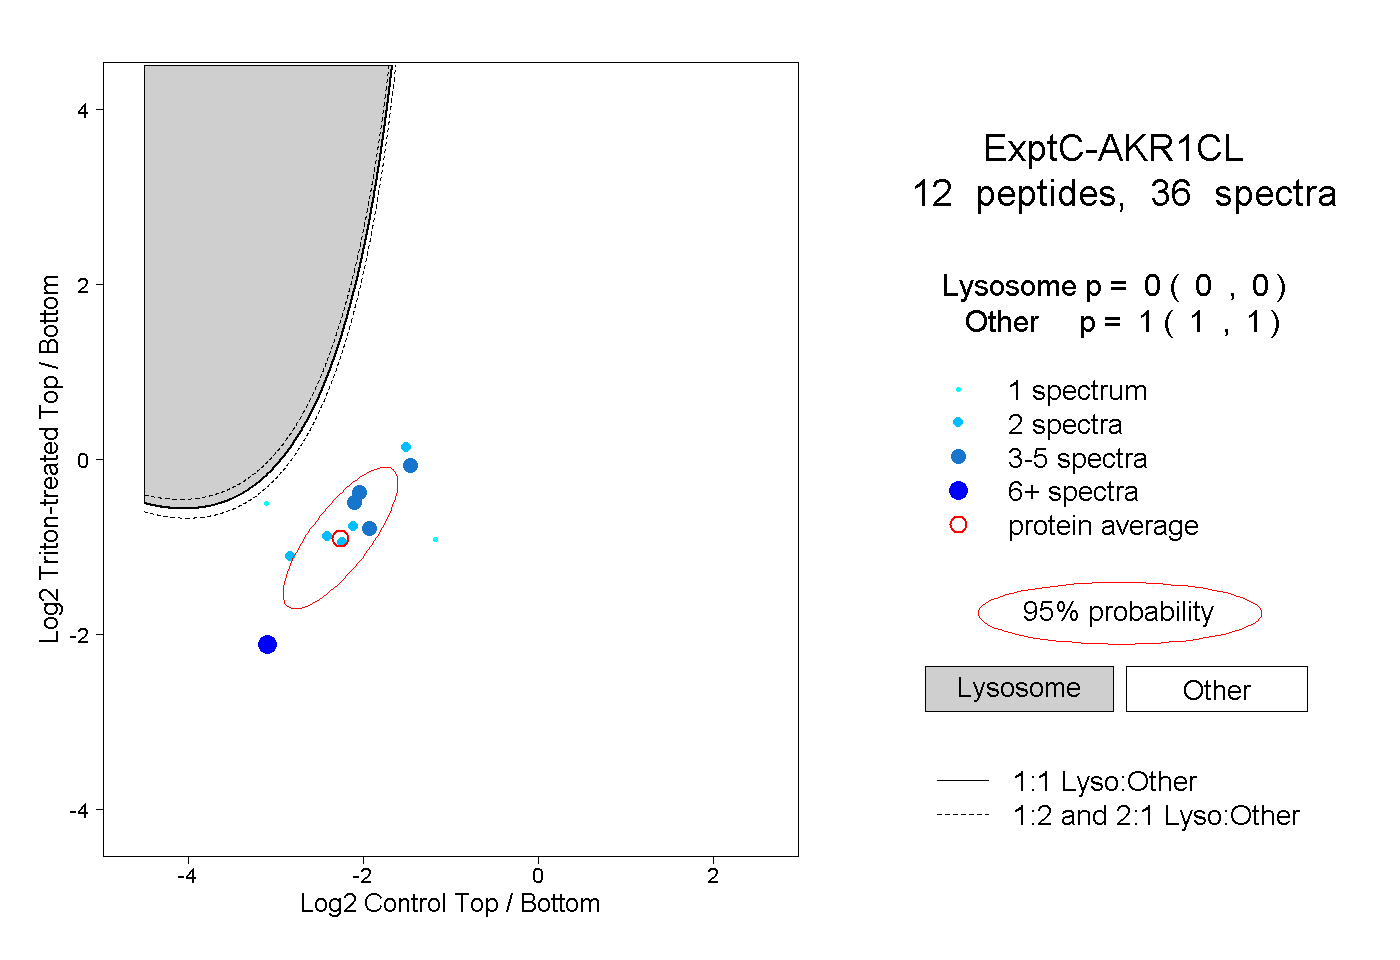
0.000 | 0.000
1.000 | 1.000