 23
23peptides
spectra
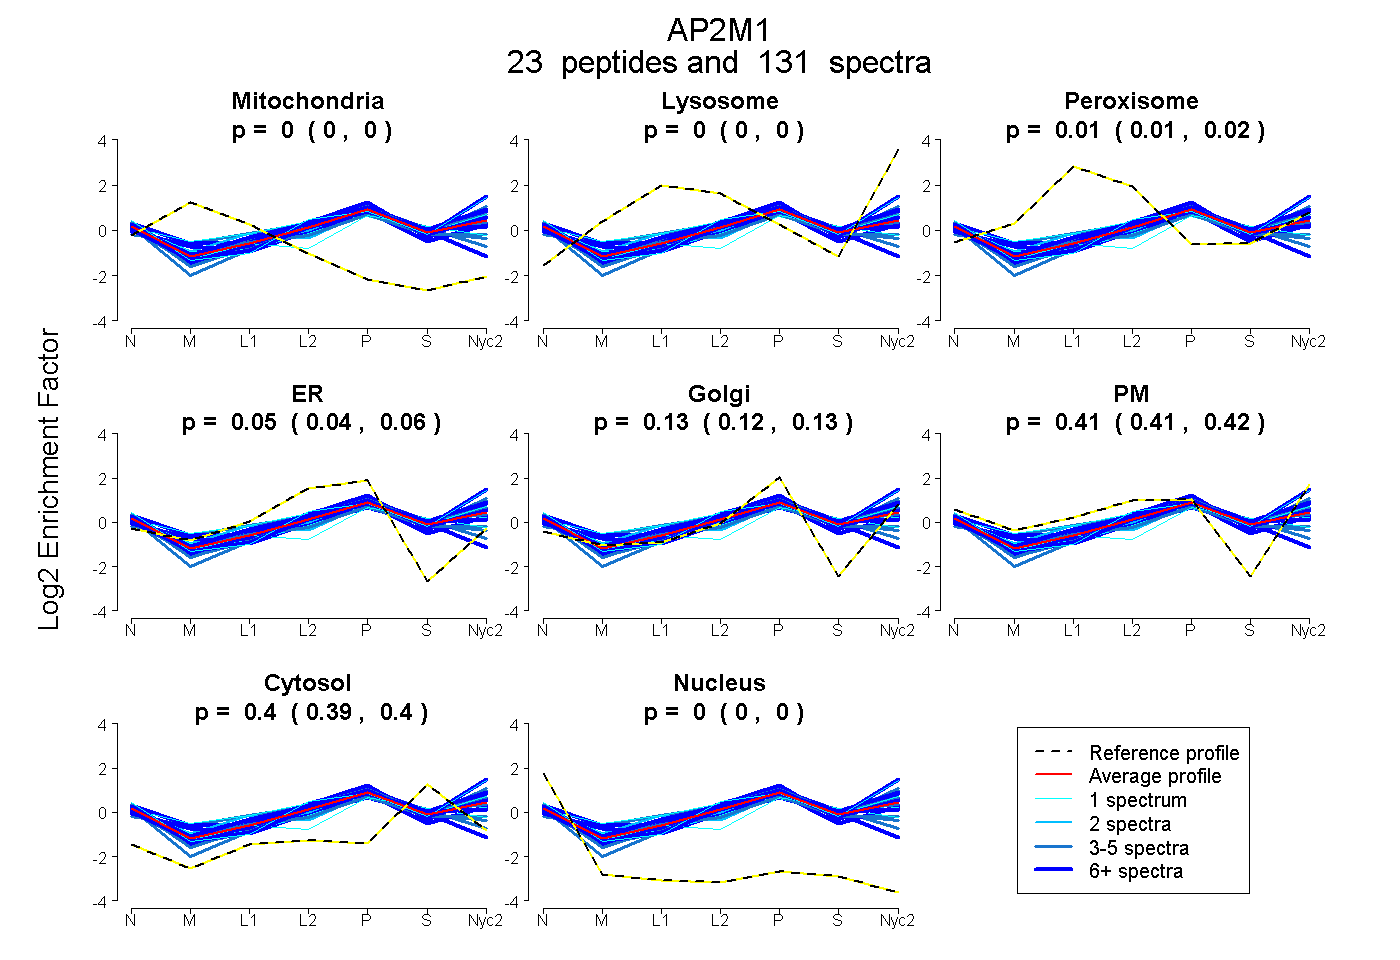
0.000 | 0.000
0.000 | 0.000
0.010 | 0.017
0.040 | 0.059
0.119 | 0.134
0.406 | 0.419
0.393 | 0.398
0.000 | 0.000
13peptides
spectra
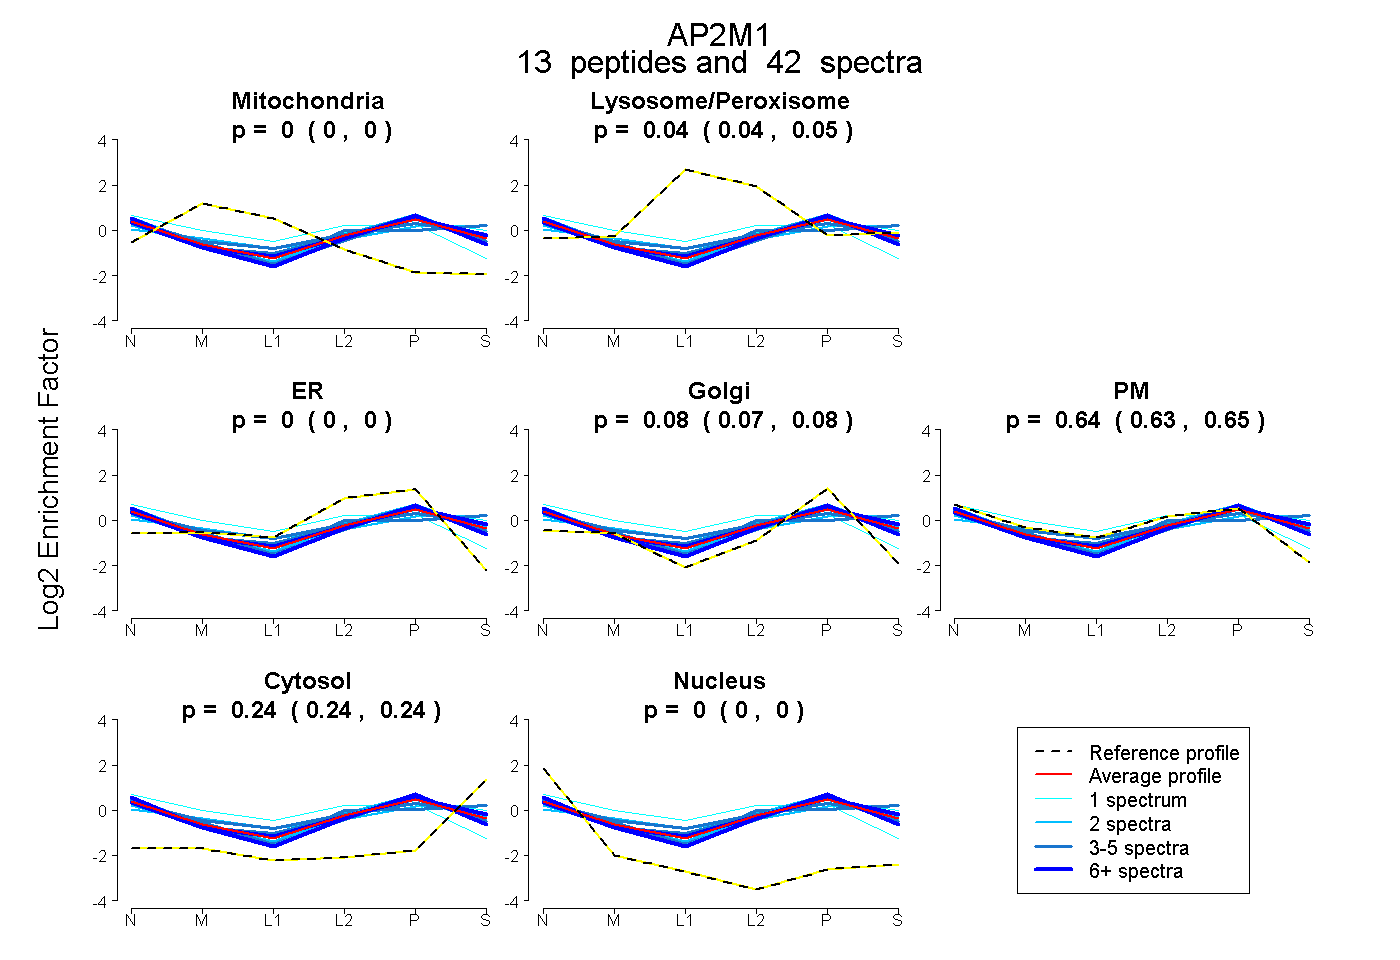
0.000 | 0.000
0.038 | 0.050
0.000 | 0.000
0.065 | 0.085
0.626 | 0.650
0.236 | 0.245
0.000 | 0.000
20peptides
spectra
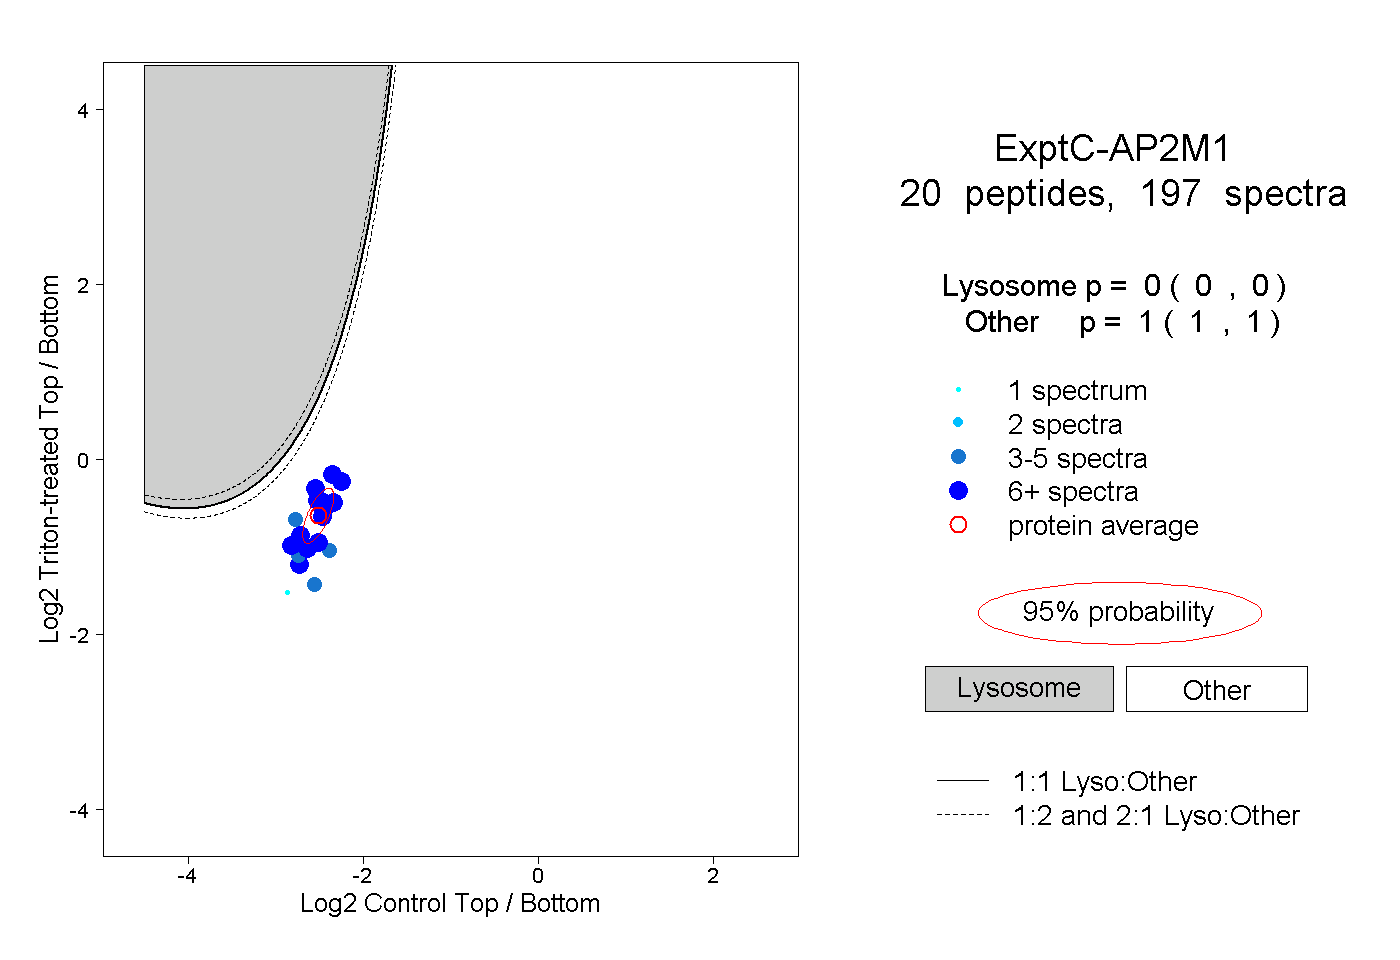
0.000 | 0.000
1.000 | 1.000
6peptides
spectra
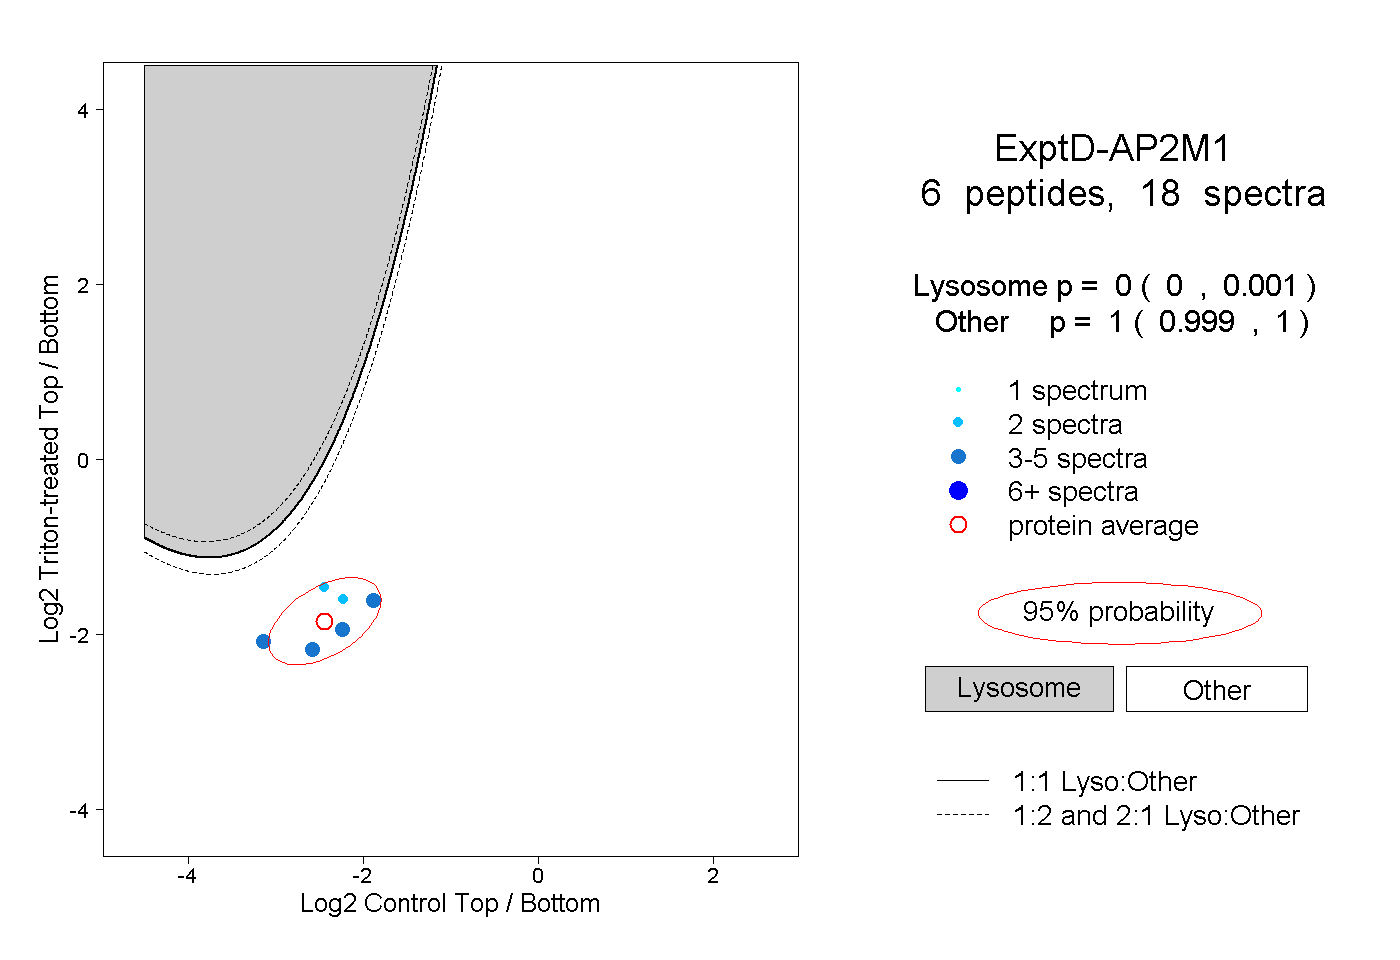
0.000 | 0.001
0.999 | 1.000