 23
23peptides
spectra
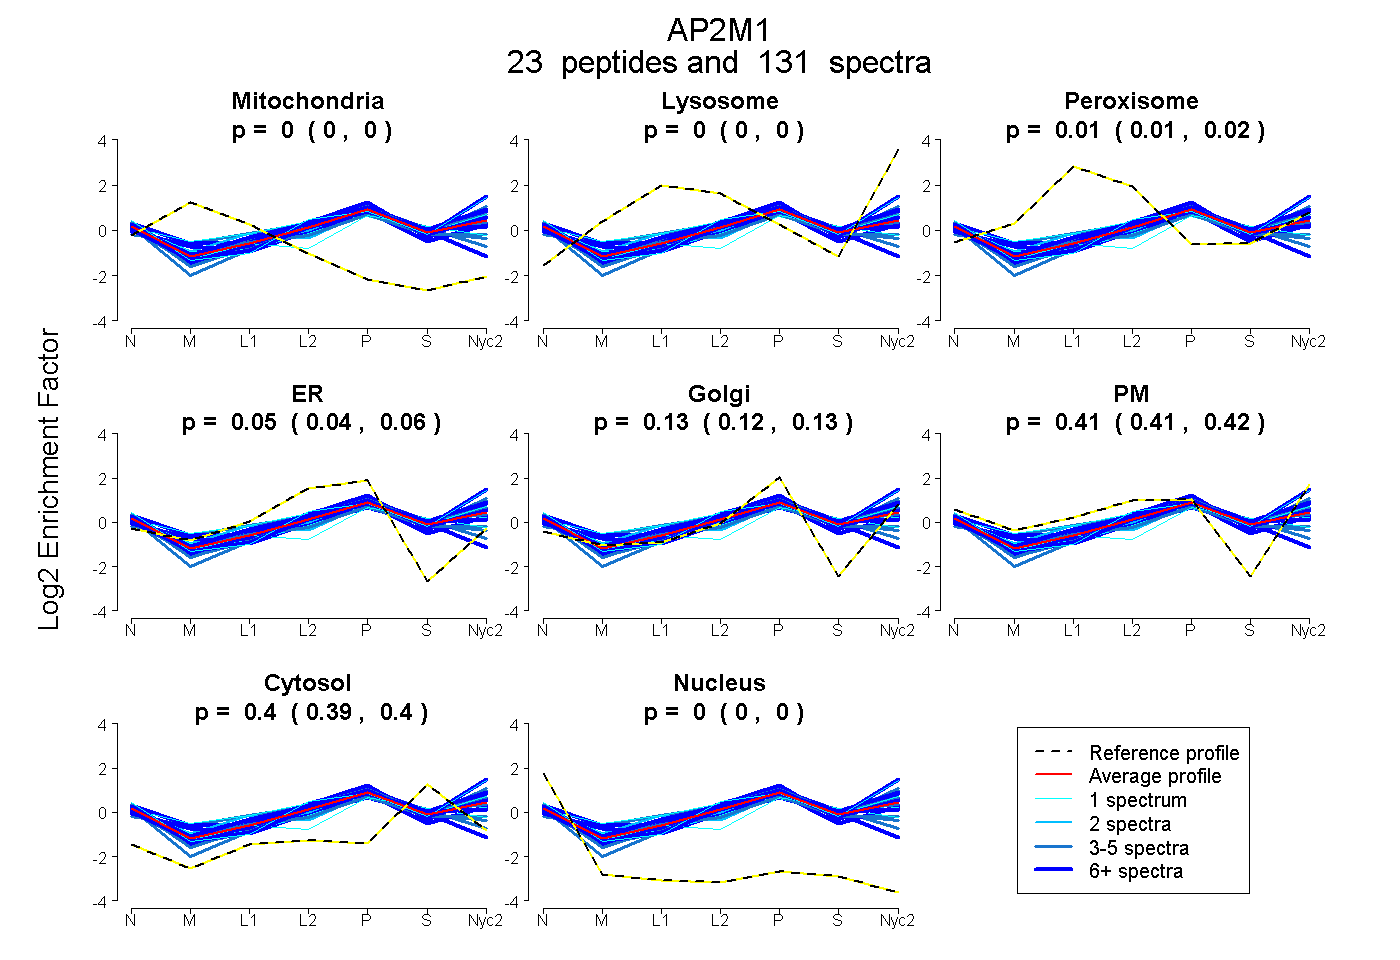
0.000 | 0.000
0.000 | 0.000
0.010 | 0.017
0.040 | 0.059
0.119 | 0.134
0.406 | 0.419
0.393 | 0.398
0.000 | 0.000
| Plot | Mito | Lyso | Perox | ER | Golgi | PM | Cytosol | Nucleus | |||||
| Expt A |
23 peptides |
131 spectra |
|
0.000 0.000 | 0.000 |
0.000 0.000 | 0.000 |
0.014 0.010 | 0.017 |
0.050 0.040 | 0.059 |
0.127 0.119 | 0.134 |
0.413 0.406 | 0.419 |
0.396 0.393 | 0.398 |
0.000 0.000 | 0.000 |
| 1 spectrum, WARPPISMNFEVPFAPSGLK | 0.000 | 0.000 | 0.000 | 0.000 | 0.010 | 0.640 | 0.350 | 0.000 | ||
| 2 spectra, SNFKPSLLAQK | 0.000 | 0.000 | 0.001 | 0.000 | 0.164 | 0.446 | 0.388 | 0.000 | ||
| 3 spectra, QNVNAAMVFEFLYK | 0.000 | 0.000 | 0.091 | 0.000 | 0.204 | 0.287 | 0.418 | 0.000 | ||
| 1 spectrum, TSFFHVK | 0.000 | 0.000 | 0.063 | 0.000 | 0.292 | 0.152 | 0.471 | 0.022 | ||
| 15 spectra, VIPLVR | 0.000 | 0.115 | 0.000 | 0.000 | 0.077 | 0.498 | 0.309 | 0.000 | ||
| 10 spectra, VNVIHAR | 0.000 | 0.000 | 0.000 | 0.128 | 0.117 | 0.310 | 0.445 | 0.000 | ||
| 4 spectra, MCDVMAAYFGK | 0.000 | 0.000 | 0.012 | 0.402 | 0.000 | 0.162 | 0.424 | 0.000 | ||
| 1 spectrum, SQHQTK | 0.000 | 0.000 | 0.164 | 0.000 | 0.050 | 0.463 | 0.323 | 0.000 | ||
| 5 spectra, SYLSGMPECK | 0.000 | 0.000 | 0.000 | 0.189 | 0.032 | 0.323 | 0.440 | 0.016 | ||
| 21 spectra, MIGGLFIYNHK | 0.000 | 0.000 | 0.037 | 0.000 | 0.155 | 0.410 | 0.399 | 0.000 | ||
| 3 spectra, GEVLISR | 0.000 | 0.000 | 0.000 | 0.000 | 0.178 | 0.402 | 0.420 | 0.000 | ||
| 4 spectra, IPTPLNTSGVQVICMK | 0.000 | 0.000 | 0.000 | 0.399 | 0.097 | 0.000 | 0.497 | 0.007 | ||
| 7 spectra, TFITQQGIK | 0.000 | 0.000 | 0.000 | 0.073 | 0.075 | 0.475 | 0.376 | 0.000 | ||
| 7 spectra, SISFIPPDGEFELMR | 0.000 | 0.050 | 0.000 | 0.000 | 0.159 | 0.410 | 0.380 | 0.000 | ||
| 5 spectra, SNIWLAAVTK | 0.000 | 0.000 | 0.000 | 0.004 | 0.161 | 0.444 | 0.391 | 0.000 | ||
| 4 spectra, GTADETSK | 0.000 | 0.042 | 0.000 | 0.000 | 0.161 | 0.422 | 0.376 | 0.000 | ||
| 5 spectra, ASENAIVWK | 0.000 | 0.145 | 0.067 | 0.000 | 0.153 | 0.331 | 0.304 | 0.000 | ||
| 9 spectra, SGIYETR | 0.000 | 0.000 | 0.000 | 0.012 | 0.178 | 0.482 | 0.328 | 0.000 | ||
| 6 spectra, QSIAIDDCTFHQCVR | 0.075 | 0.000 | 0.000 | 0.463 | 0.000 | 0.000 | 0.458 | 0.004 | ||
| 9 spectra, ISEENIK | 0.026 | 0.000 | 0.031 | 0.016 | 0.198 | 0.405 | 0.323 | 0.000 | ||
| 1 spectrum, SPVTNIAR | 0.000 | 0.000 | 0.000 | 0.010 | 0.128 | 0.416 | 0.445 | 0.000 | ||
| 2 spectra, LNYSDHDVIK | 0.000 | 0.000 | 0.139 | 0.000 | 0.248 | 0.243 | 0.369 | 0.000 | ||
| 6 spectra, FGMNDK | 0.000 | 0.025 | 0.000 | 0.000 | 0.142 | 0.486 | 0.347 | 0.000 |
| Plot | Mito | Lyso or Perox | ER | Golgi | PM | Cytosol | Nucleus | ||||||
| Expt B |
13 peptides |
42 spectra |
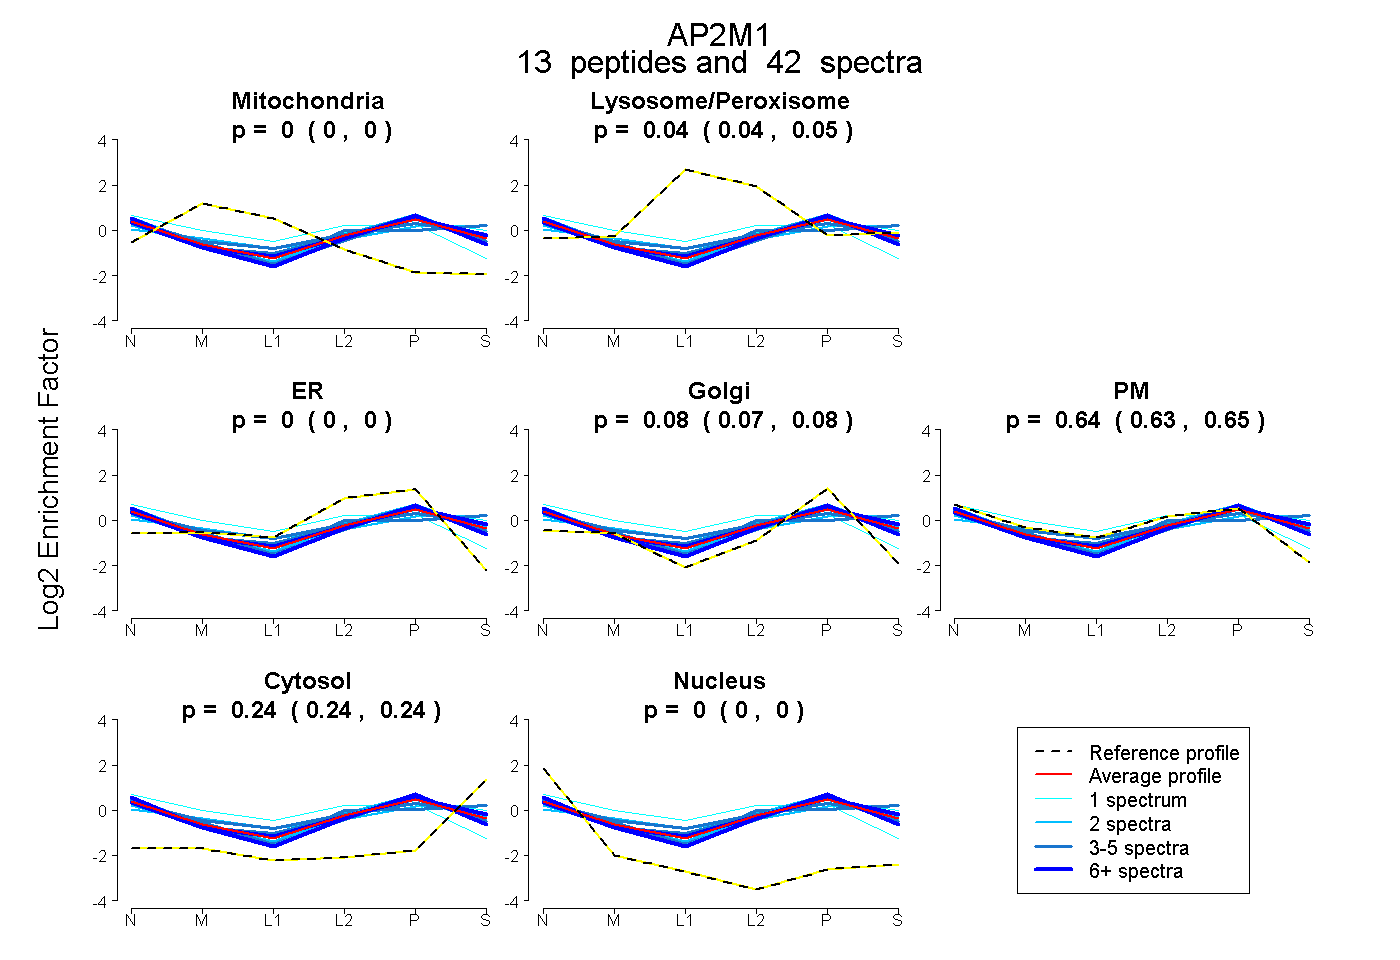 |
0.000 0.000 | 0.000 |
0.044 0.038 | 0.050 |
0.000 0.000 | 0.000 |
0.076 0.065 | 0.085 |
0.639 0.626 | 0.650 |
0.241 0.236 | 0.245 |
0.000 0.000 | 0.000 |
|||
| Plot | Lyso | Other | |||||||||||
| Expt C |
20 peptides |
197 spectra |
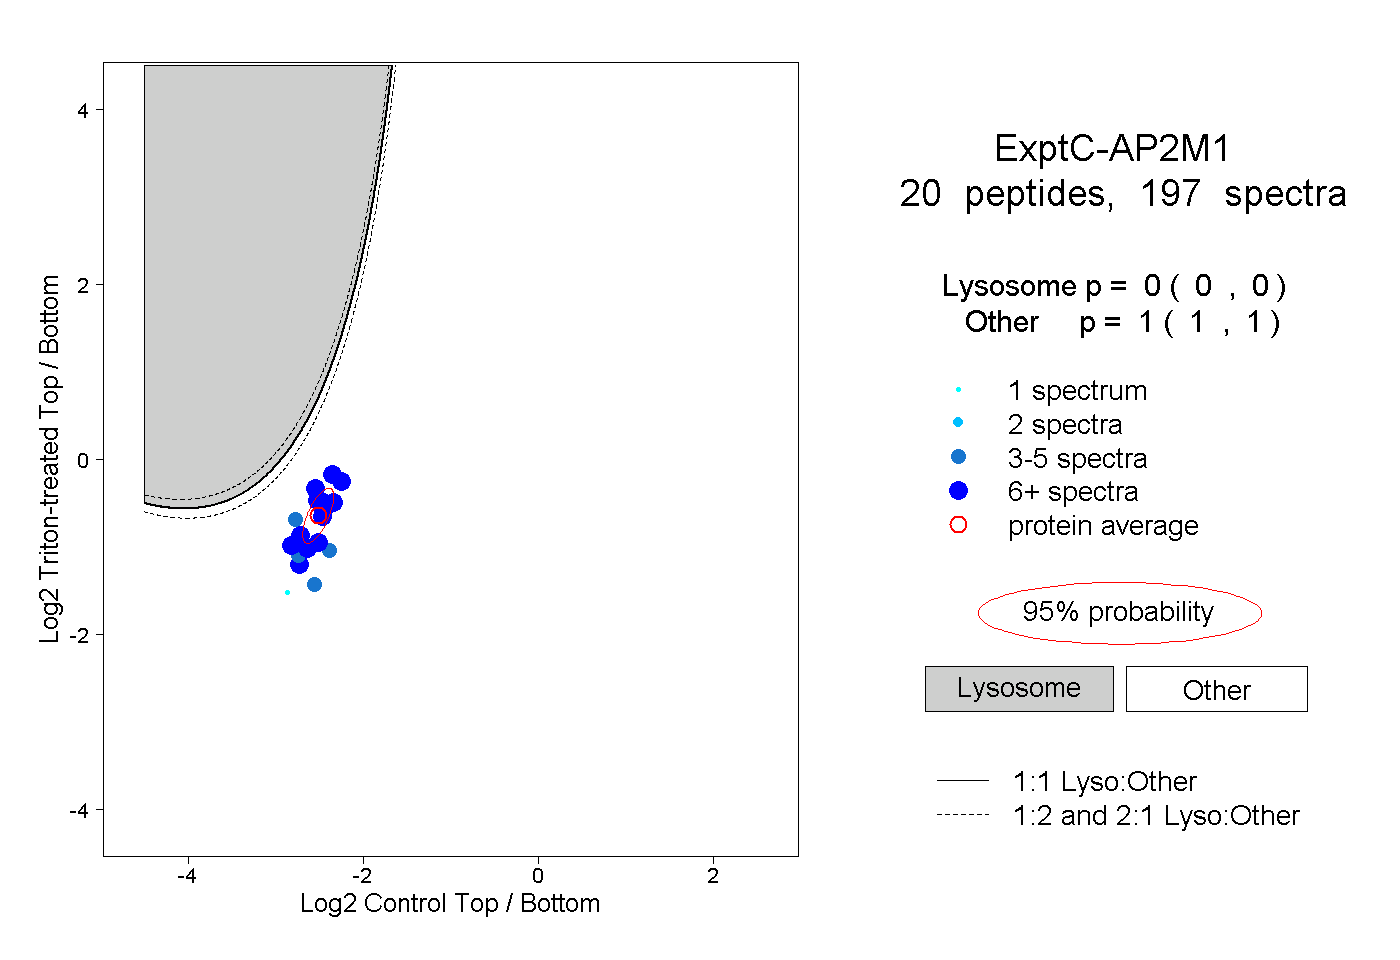 |
0.000 0.000 | 0.000 |
1.000 1.000 | 1.000 |
||||||||
| Plot | Lyso | Other | |||||||||||
| Expt D |
6 peptides |
18 spectra |
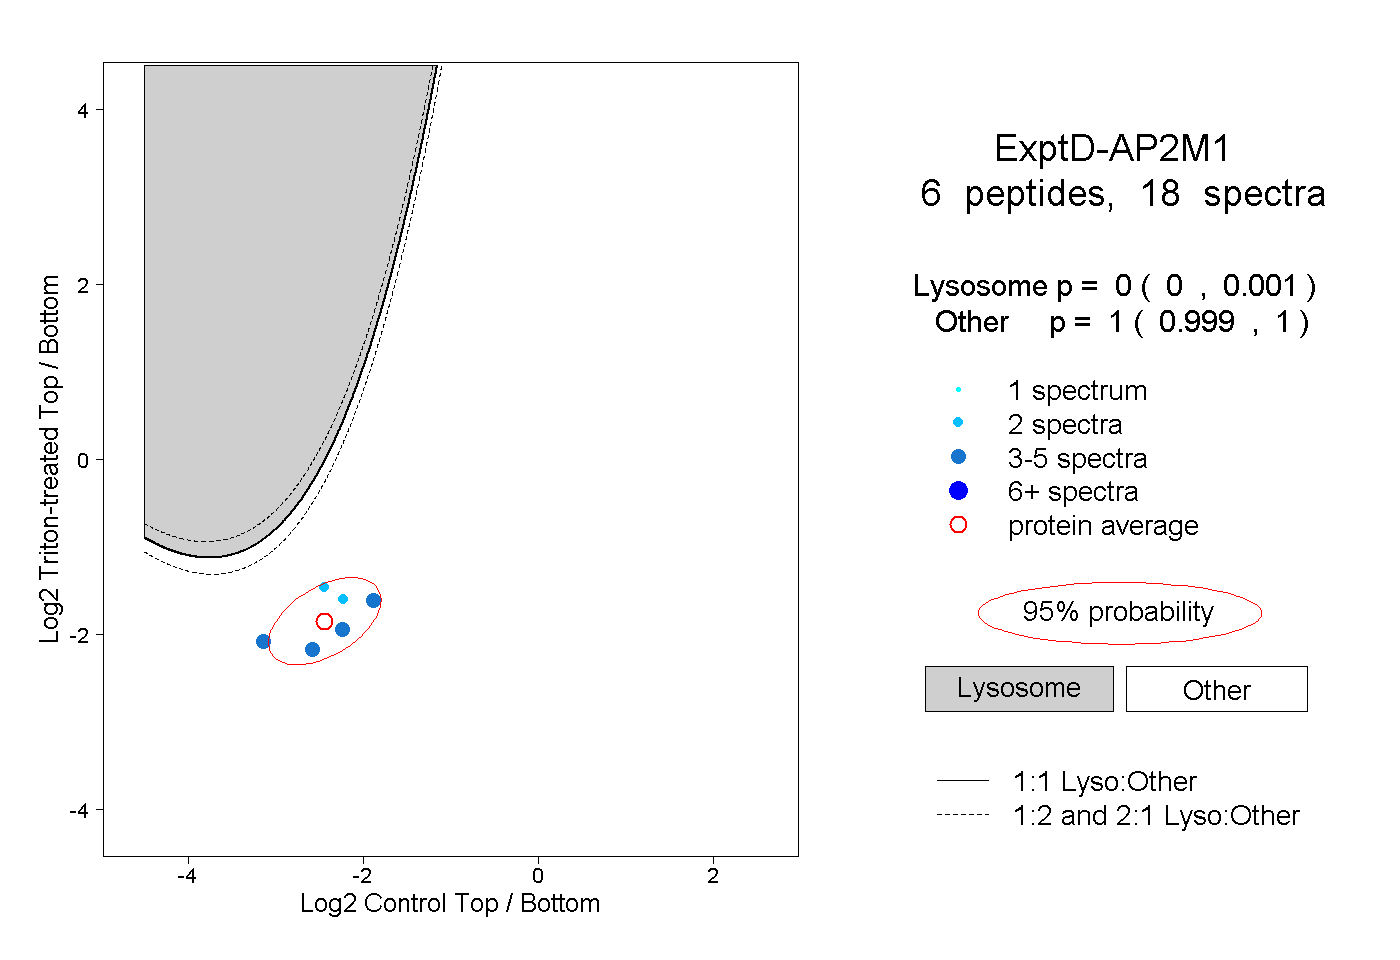 |
0.000 0.000 | 0.001 |
1.000 0.999 | 1.000 |