 3
3peptides
spectra
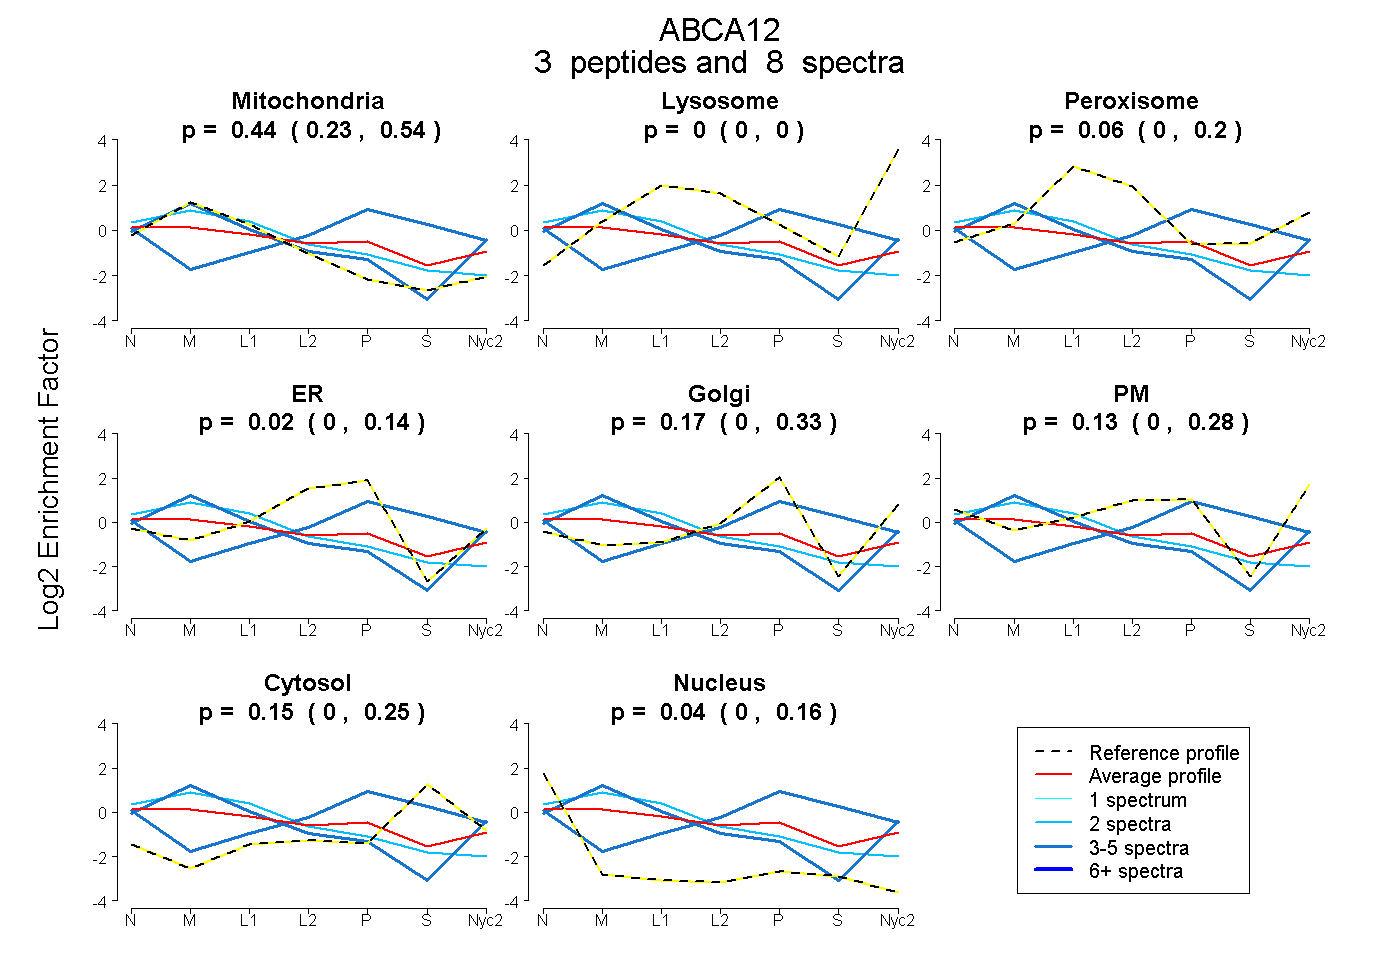
0.226 | 0.545
0.000 | 0.000
0.000 | 0.204
0.000 | 0.138
0.000 | 0.329
0.000 | 0.282
0.004 | 0.246
0.000 | 0.162
3peptides
spectra
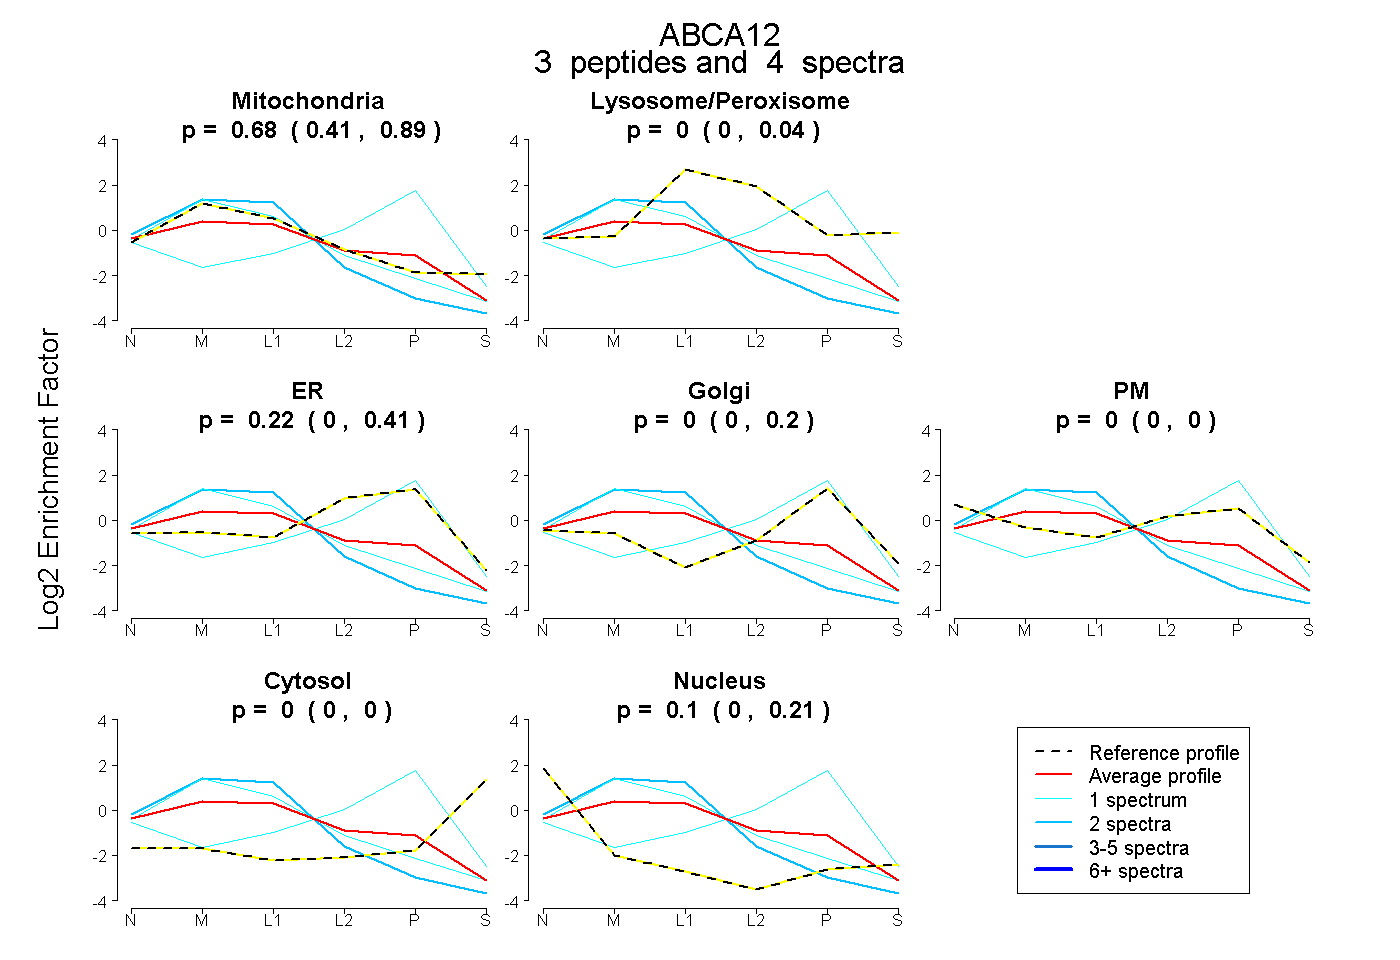
0.405 | 0.892
0.000 | 0.044
0.000 | 0.406
0.000 | 0.198
0.000 | 0.000
0.000 | 0.000
0.000 | 0.212
3peptides
spectra
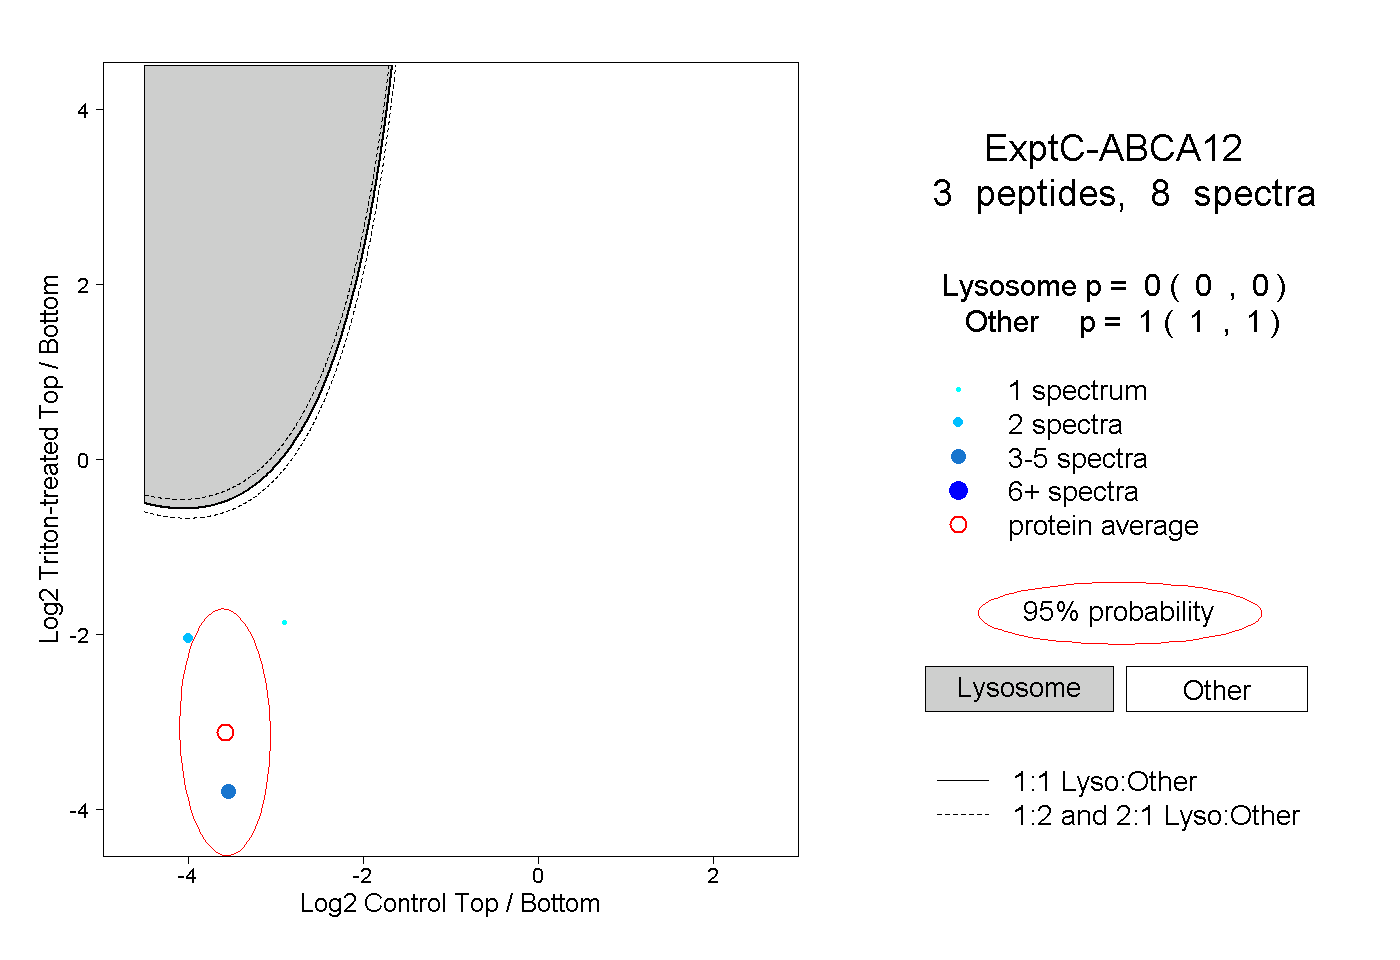
0.000 | 0.000
1.000 | 1.000
1peptide
spectra
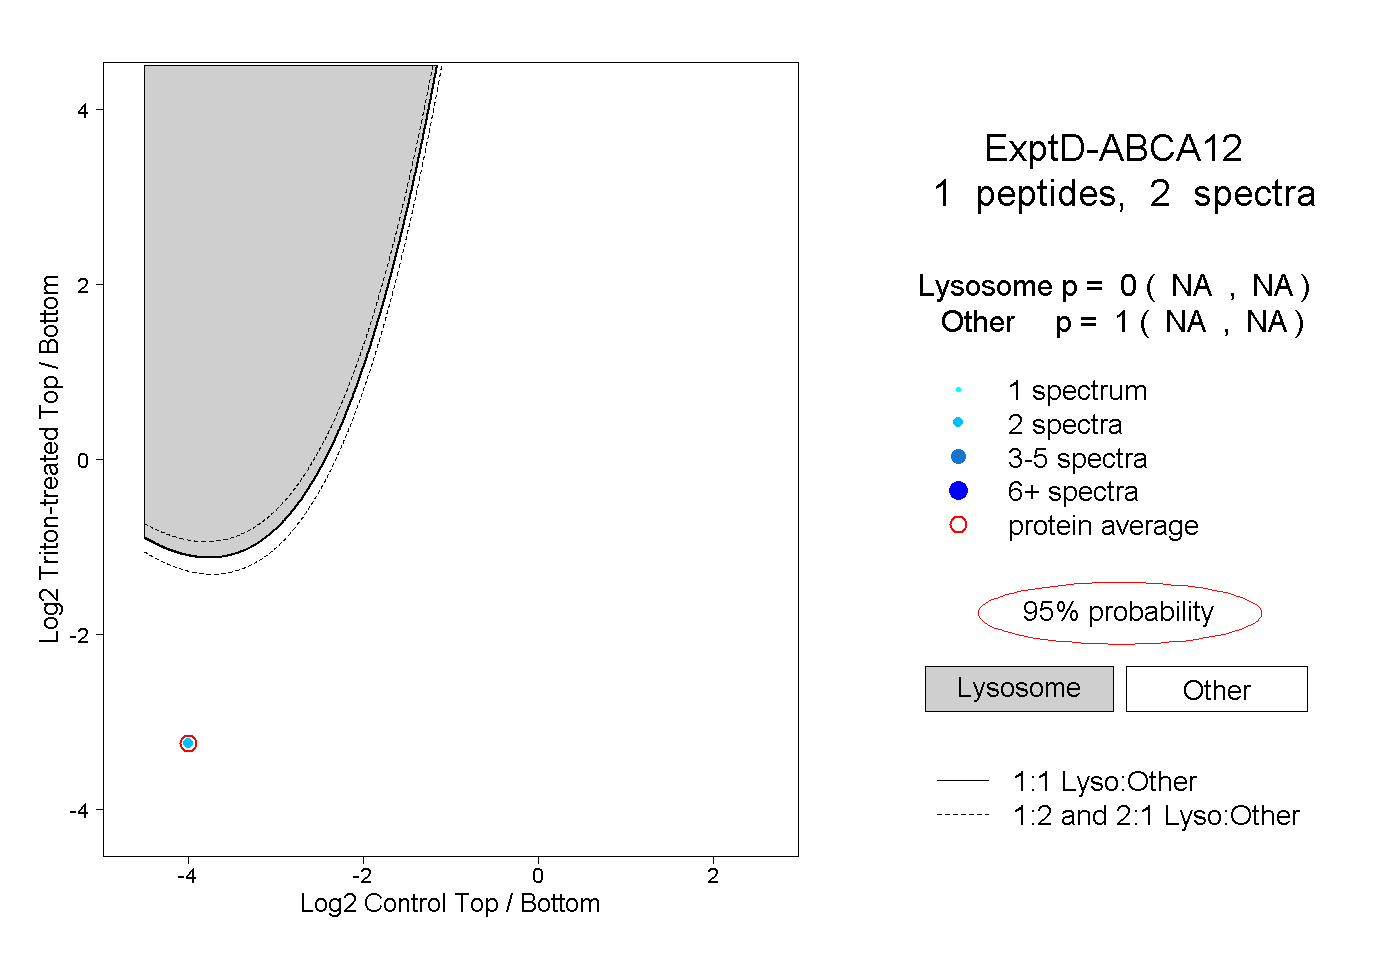
NA | NA
NA | NA