 3
3peptides
spectra
0.226 | 0.545
0.000 | 0.000
0.000 | 0.204
0.000 | 0.138
0.000 | 0.329
0.000 | 0.282
0.004 | 0.246
0.000 | 0.162
| Plot | Mito | Lyso | Perox | ER | Golgi | PM | Cytosol | Nucleus | |||||
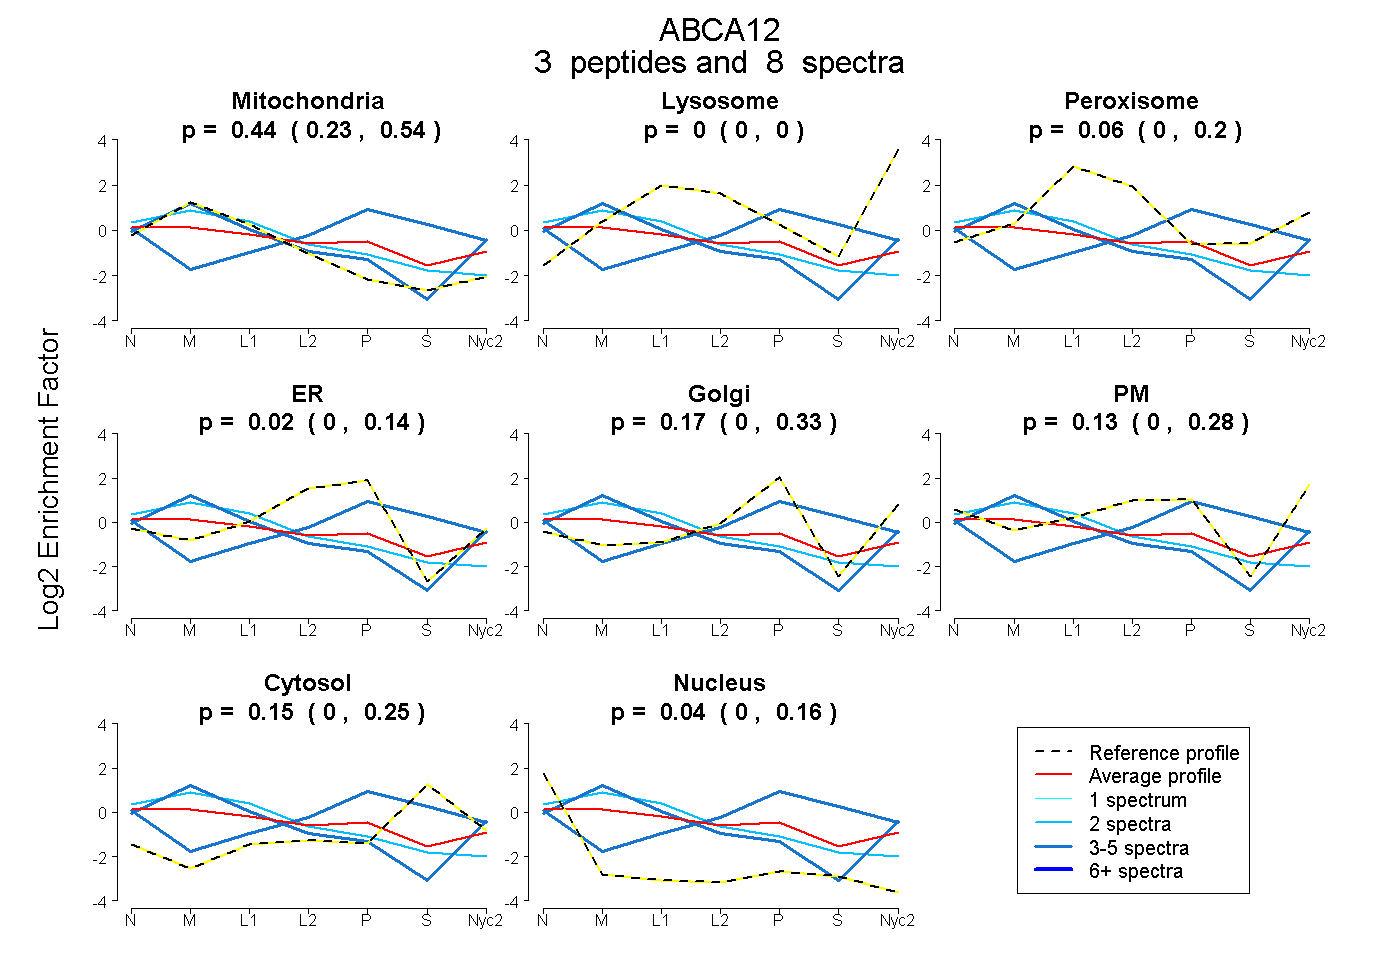
| Expt A |
3 peptides |
8 spectra |
|
0.435 0.226 | 0.545 |
0.000 0.000 | 0.000 |
0.056 0.000 | 0.204 |
0.023 0.000 | 0.138 |
0.166 0.000 | 0.329 |
0.134 0.000 | 0.282 |
0.147 0.004 | 0.246 |
0.039 0.000 | 0.162 |
| 3 spectra, VFFPR | 0.711 | 0.007 | 0.000 | 0.000 | 0.000 | 0.282 | 0.000 | 0.000 | ||
| 3 spectra, ILDLEK | 0.000 | 0.000 | 0.000 | 0.257 | 0.208 | 0.022 | 0.513 | 0.000 | ||
| 2 spectra, AIIELQTGR | 0.672 | 0.000 | 0.127 | 0.116 | 0.000 | 0.000 | 0.018 | 0.068 |
| Plot | Mito | Lyso or Perox | ER | Golgi | PM | Cytosol | Nucleus | ||||||
| Expt B |
3 peptides |
4 spectra |
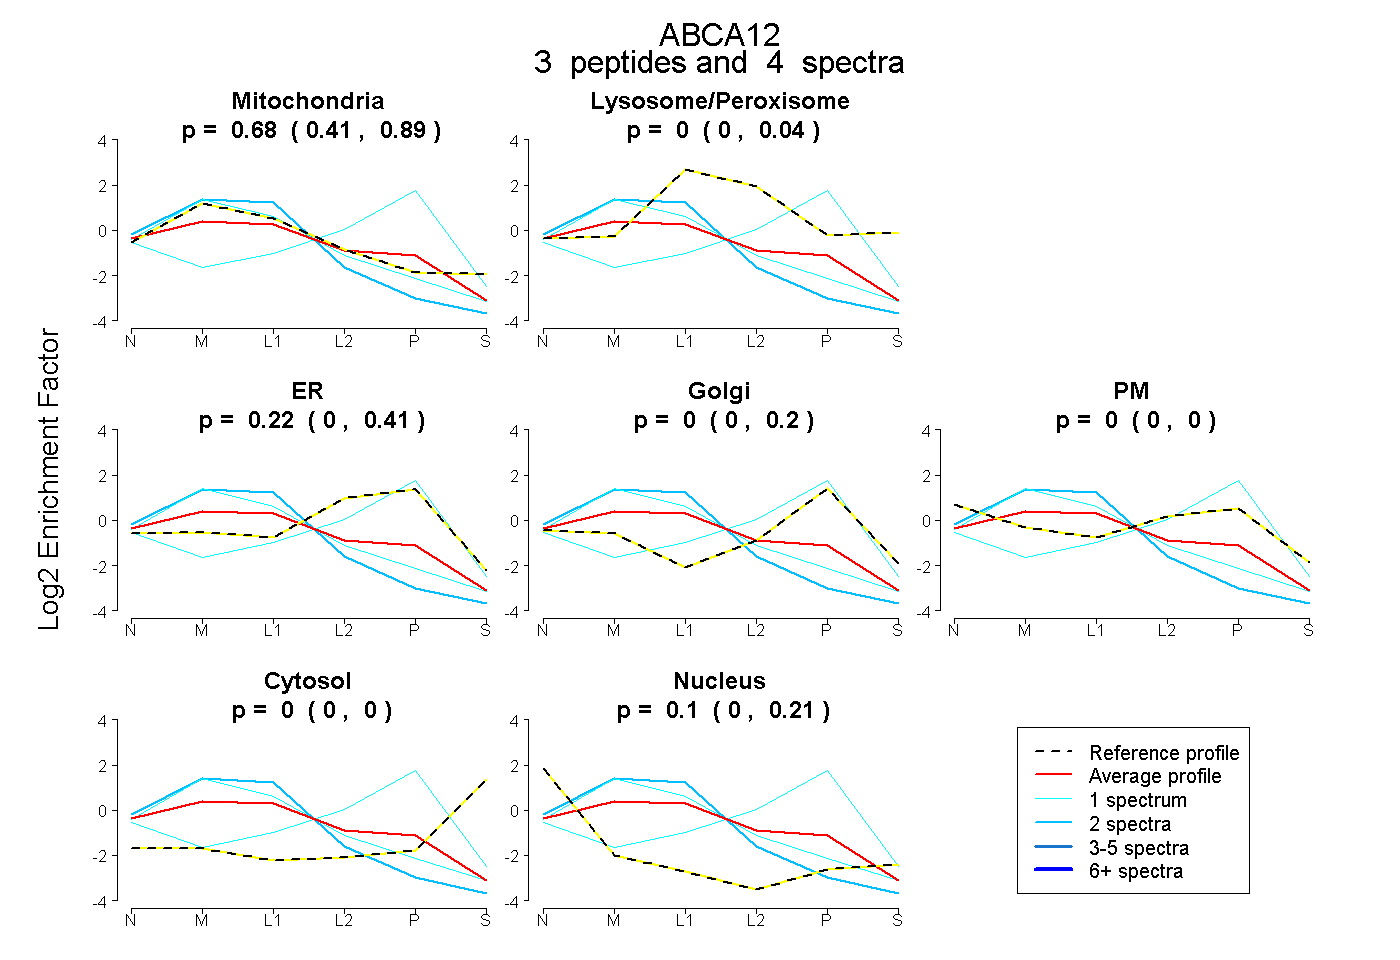 |
0.680 0.405 | 0.892 |
0.000 0.000 | 0.044 |
0.219 0.000 | 0.406 |
0.000 0.000 | 0.198 |
0.000 0.000 | 0.000 |
0.000 0.000 | 0.000 |
0.100 0.000 | 0.212 |
|||
| Plot | Lyso | Other | |||||||||||
| Expt C |
3 peptides |
8 spectra |
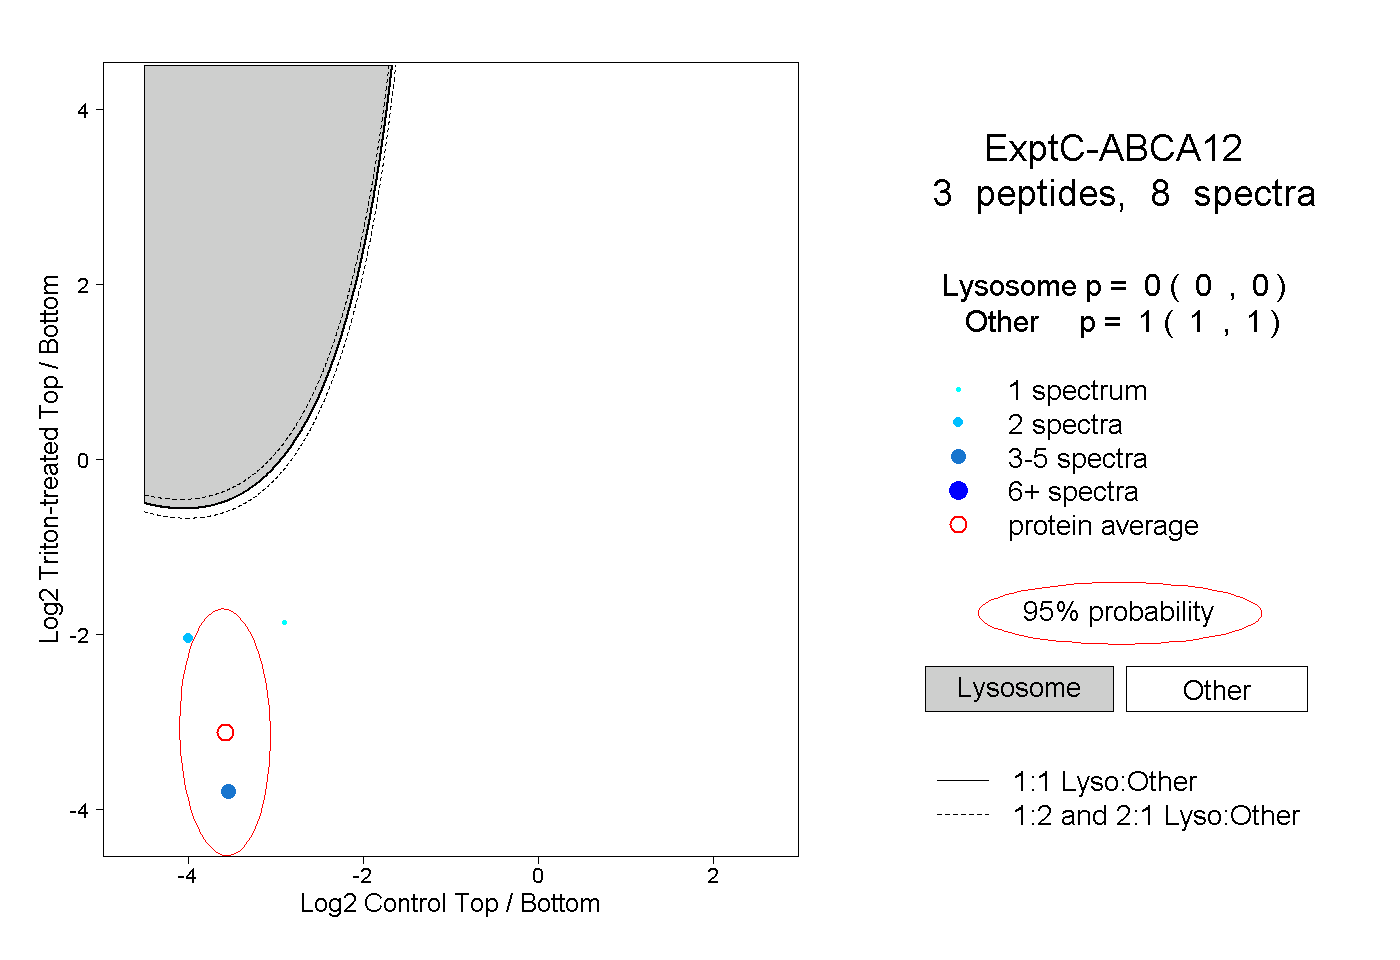 |
0.000 0.000 | 0.000 |
1.000 1.000 | 1.000 |
||||||||
| Plot | Lyso | Other | |||||||||||
| Expt D |
1 peptide |
2 spectra |
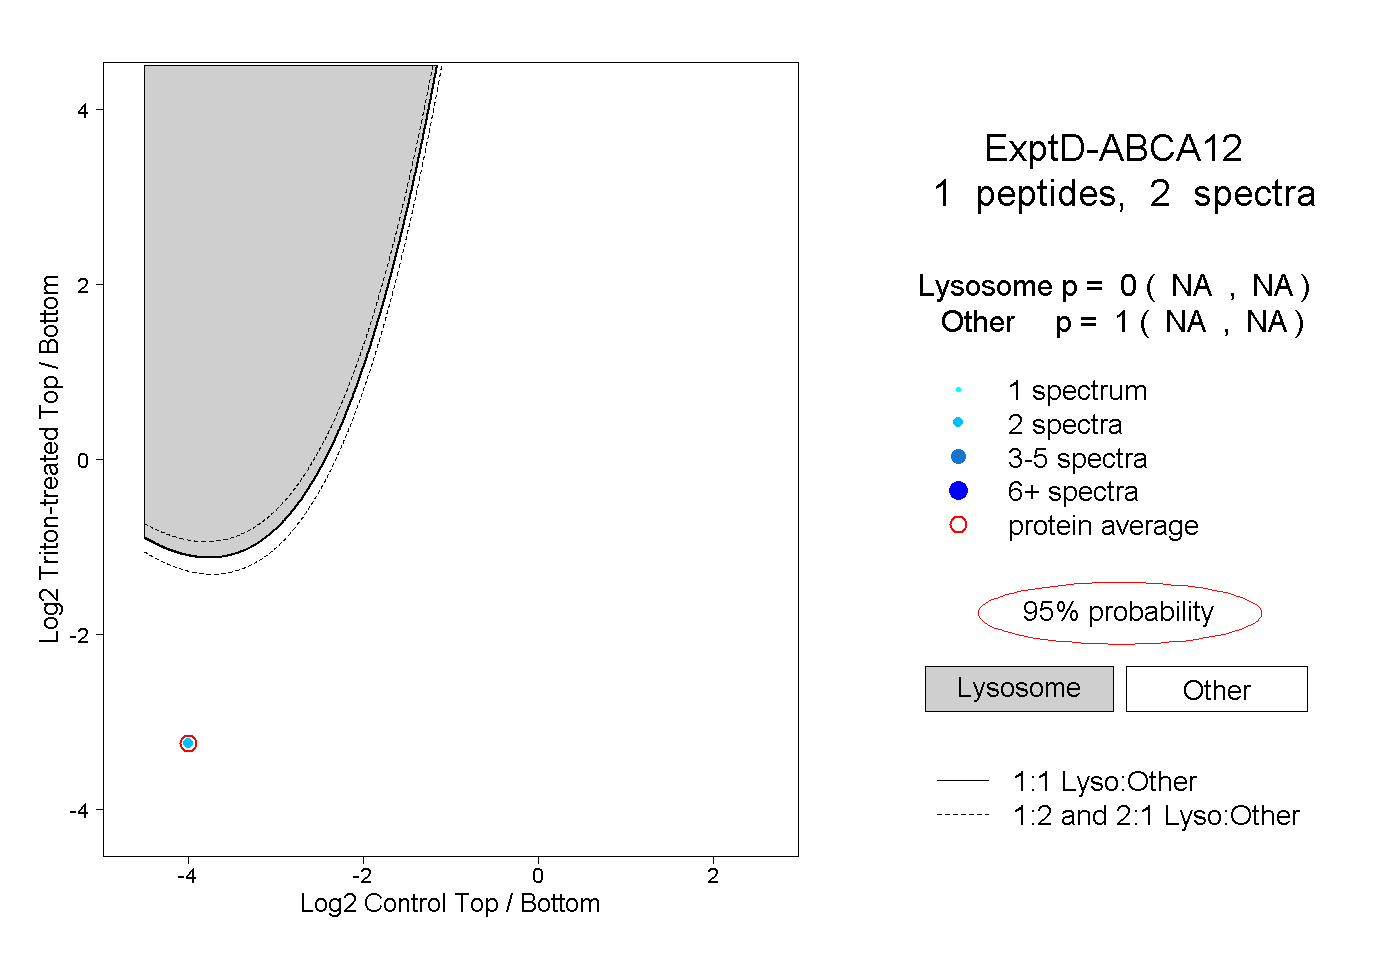 |
0.000 NA | NA |
1.000 NA | NA |