 4
4peptides
spectra
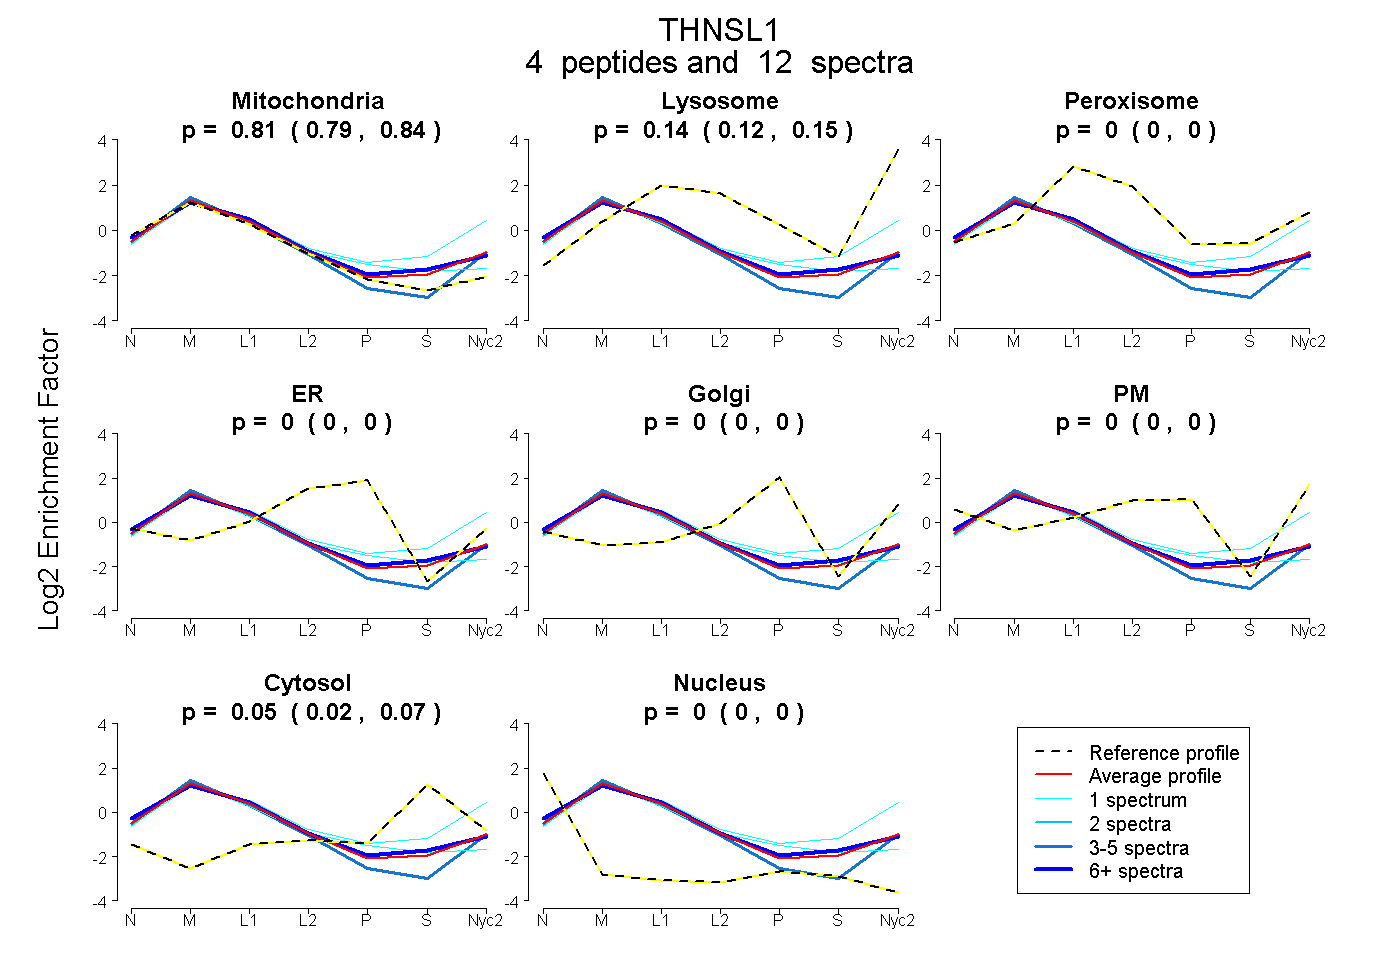
0.786 | 0.839
0.118 | 0.152
0.000 | 0.000
0.000 | 0.000
0.000 | 0.000
0.000 | 0.000
0.023 | 0.069
0.000 | 0.000
3peptides
spectra
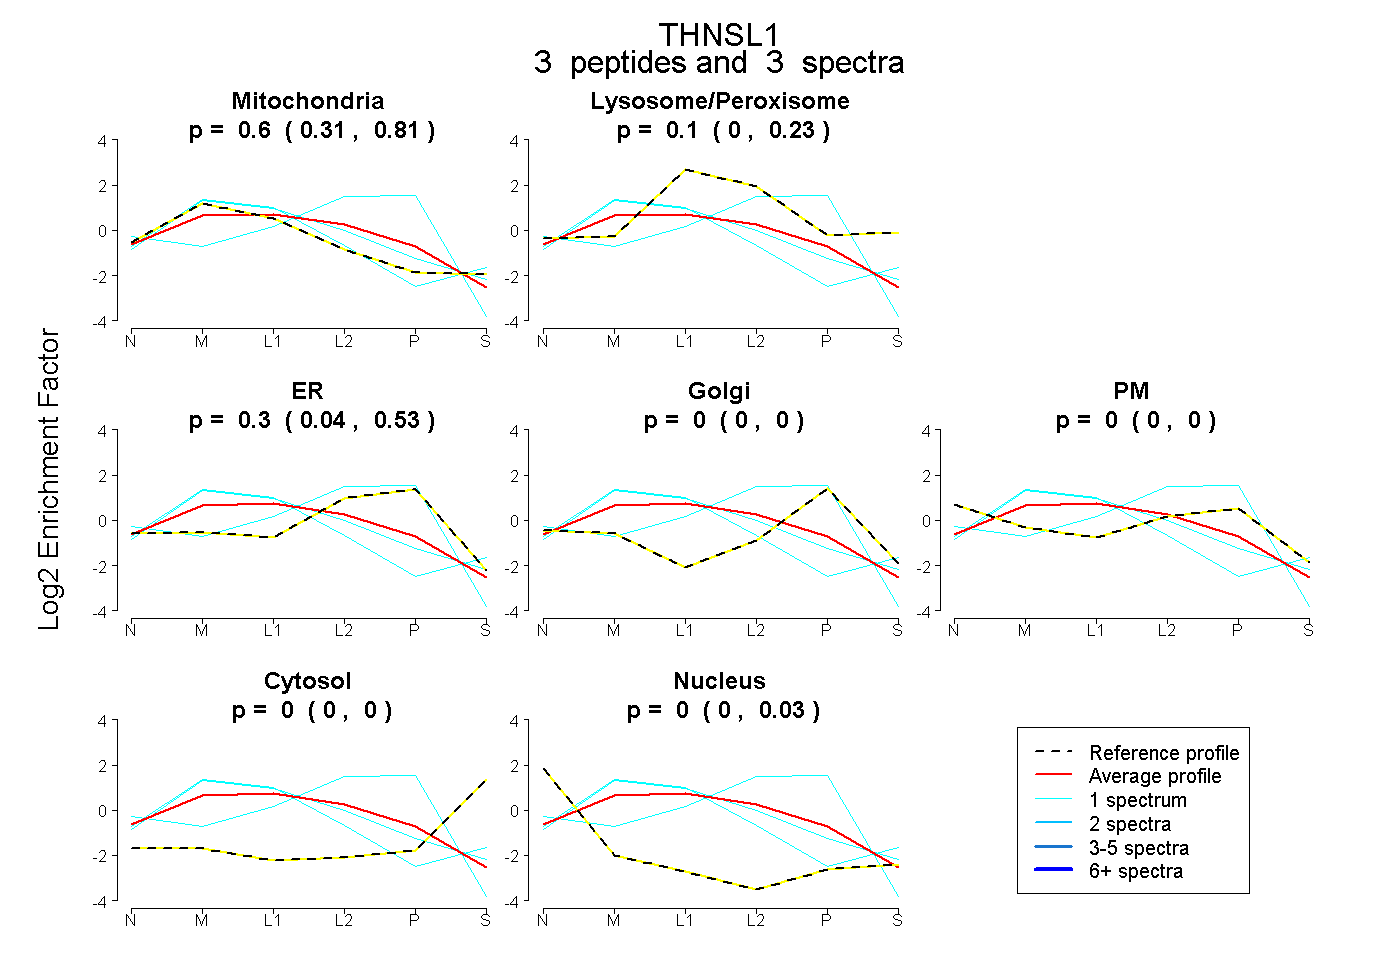
0.310 | 0.807
0.000 | 0.231
0.040 | 0.528
0.000 | 0.000
0.000 | 0.000
0.000 | 0.000
0.000 | 0.029
10peptides
spectra
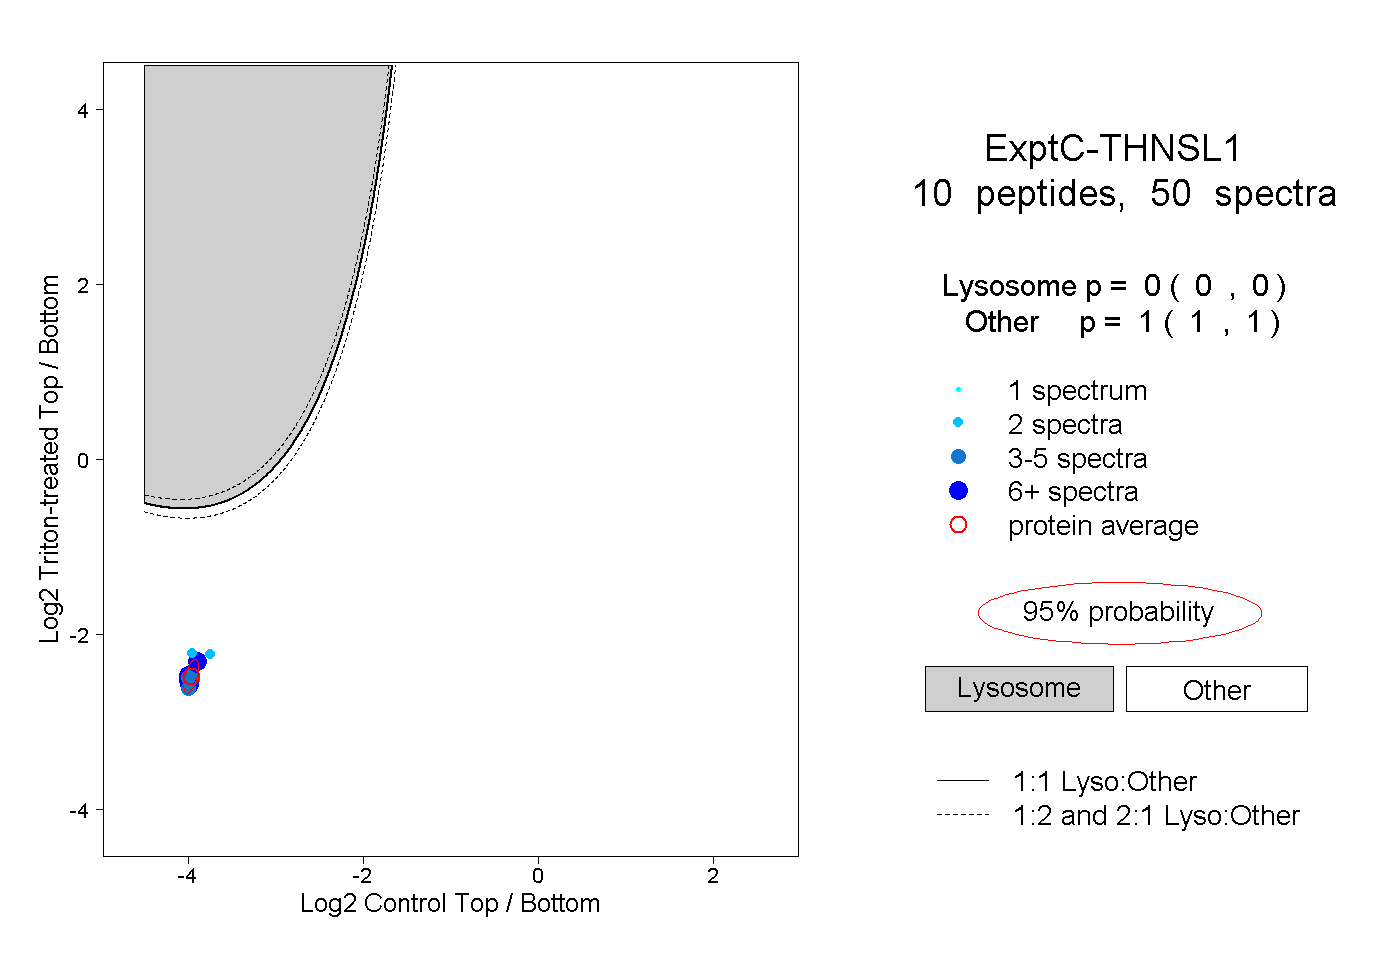
0.000 | 0.000
1.000 | 1.000
4peptides
spectra

0.000 | 0.000
1.000 | 1.000