 4
4peptides
spectra
0.786 | 0.839
0.118 | 0.152
0.000 | 0.000
0.000 | 0.000
0.000 | 0.000
0.000 | 0.000
0.023 | 0.069
0.000 | 0.000
| Plot | Mito | Lyso | Perox | ER | Golgi | PM | Cytosol | Nucleus | |||||
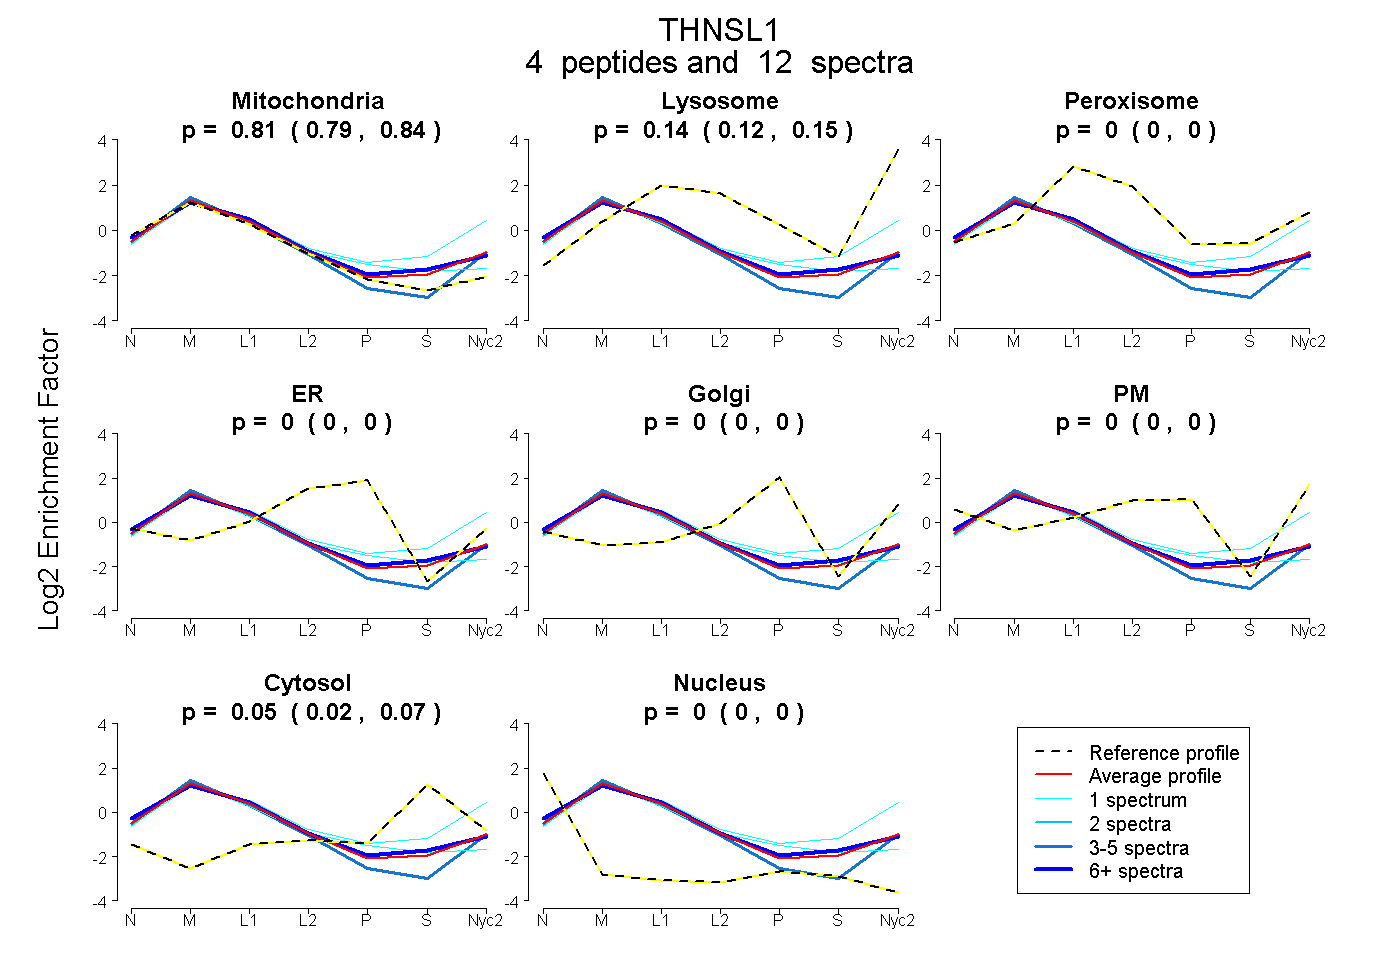
| Expt A |
4 peptides |
12 spectra |
|
0.814 0.786 | 0.839 |
0.136 0.118 | 0.152 |
0.000 0.000 | 0.000 |
0.000 0.000 | 0.000 |
0.000 0.000 | 0.000 |
0.000 0.000 | 0.000 |
0.049 0.023 | 0.069 |
0.000 0.000 | 0.000 |
| 6 spectra, LQDVANDR | 0.785 | 0.105 | 0.036 | 0.000 | 0.000 | 0.000 | 0.074 | 0.000 | ||
| 1 spectrum, LGCCVIDVDADVLEK | 0.818 | 0.043 | 0.046 | 0.000 | 0.013 | 0.000 | 0.081 | 0.000 | ||
| 1 spectrum, AQVLLER | 0.546 | 0.341 | 0.000 | 0.000 | 0.000 | 0.000 | 0.114 | 0.000 | ||
| 4 spectra, FAPVVLQALR | 0.913 | 0.087 | 0.000 | 0.000 | 0.000 | 0.000 | 0.000 | 0.000 |
| Plot | Mito | Lyso or Perox | ER | Golgi | PM | Cytosol | Nucleus | ||||||
| Expt B |
3 peptides |
3 spectra |
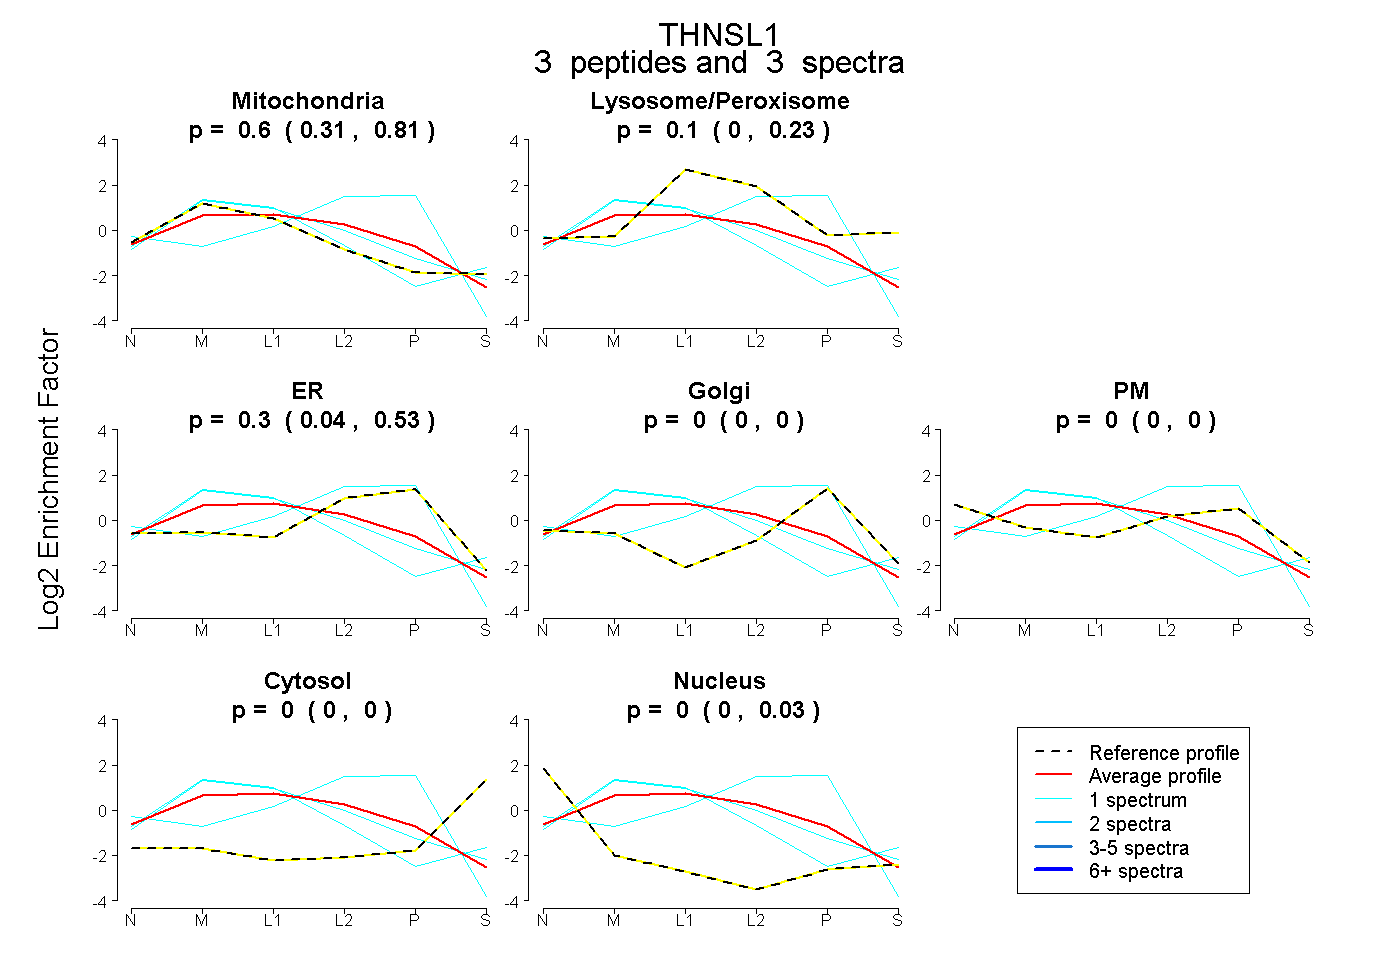 |
0.597 0.310 | 0.807 |
0.103 0.000 | 0.231 |
0.300 0.040 | 0.528 |
0.000 0.000 | 0.000 |
0.000 0.000 | 0.000 |
0.000 0.000 | 0.000 |
0.000 0.000 | 0.029 |
|||
| Plot | Lyso | Other | |||||||||||
| Expt C |
10 peptides |
50 spectra |
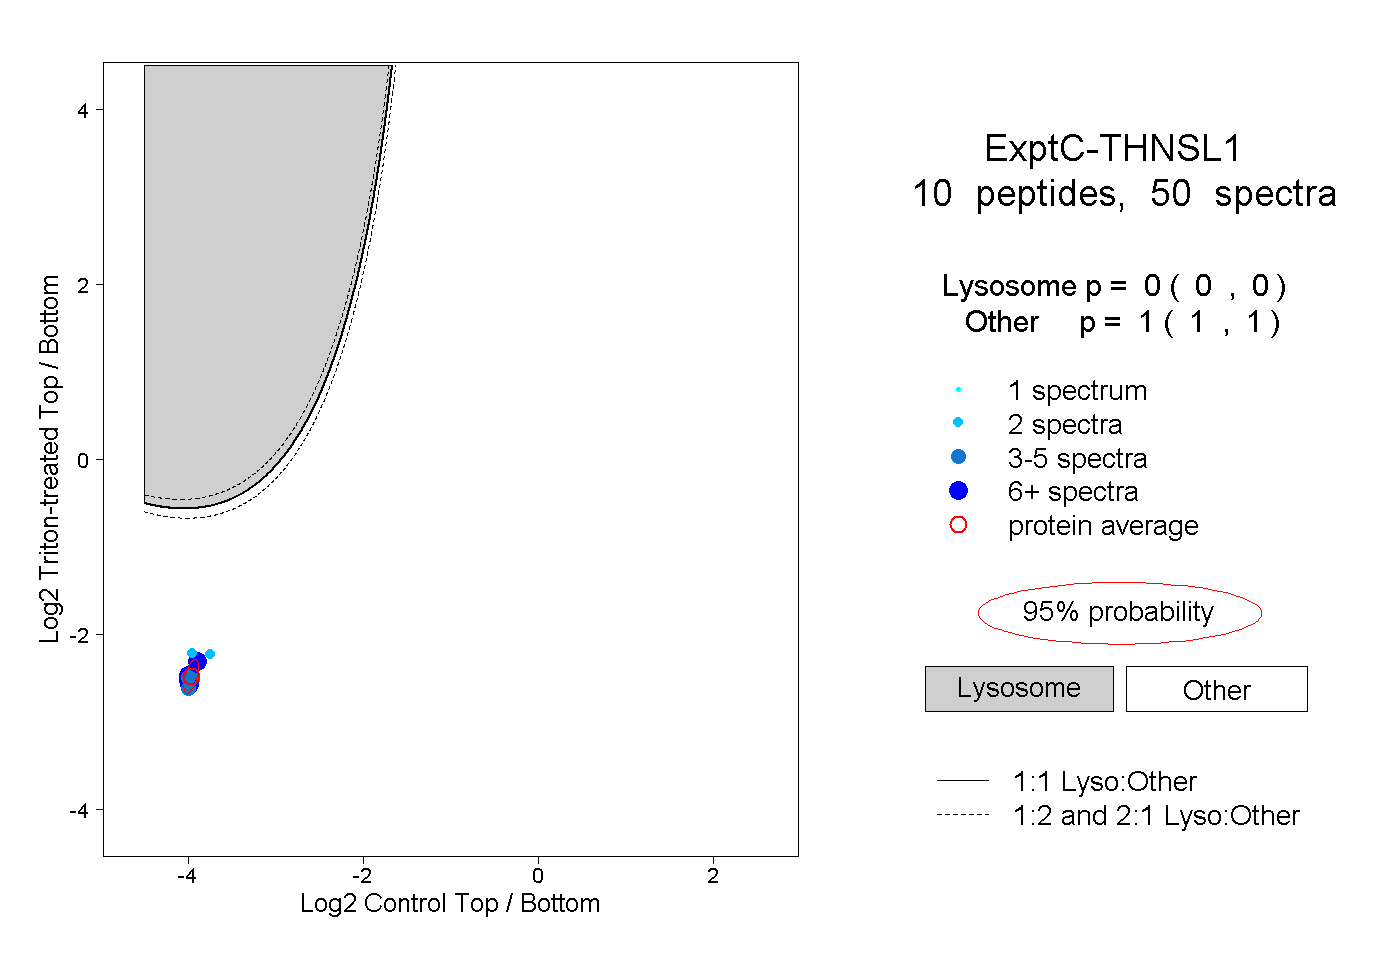 |
0.000 0.000 | 0.000 |
1.000 1.000 | 1.000 |
||||||||
| Plot | Lyso | Other | |||||||||||
| Expt D |
4 peptides |
8 spectra |
 |
0.000 0.000 | 0.000 |
1.000 1.000 | 1.000 |