 10
10peptides
spectra
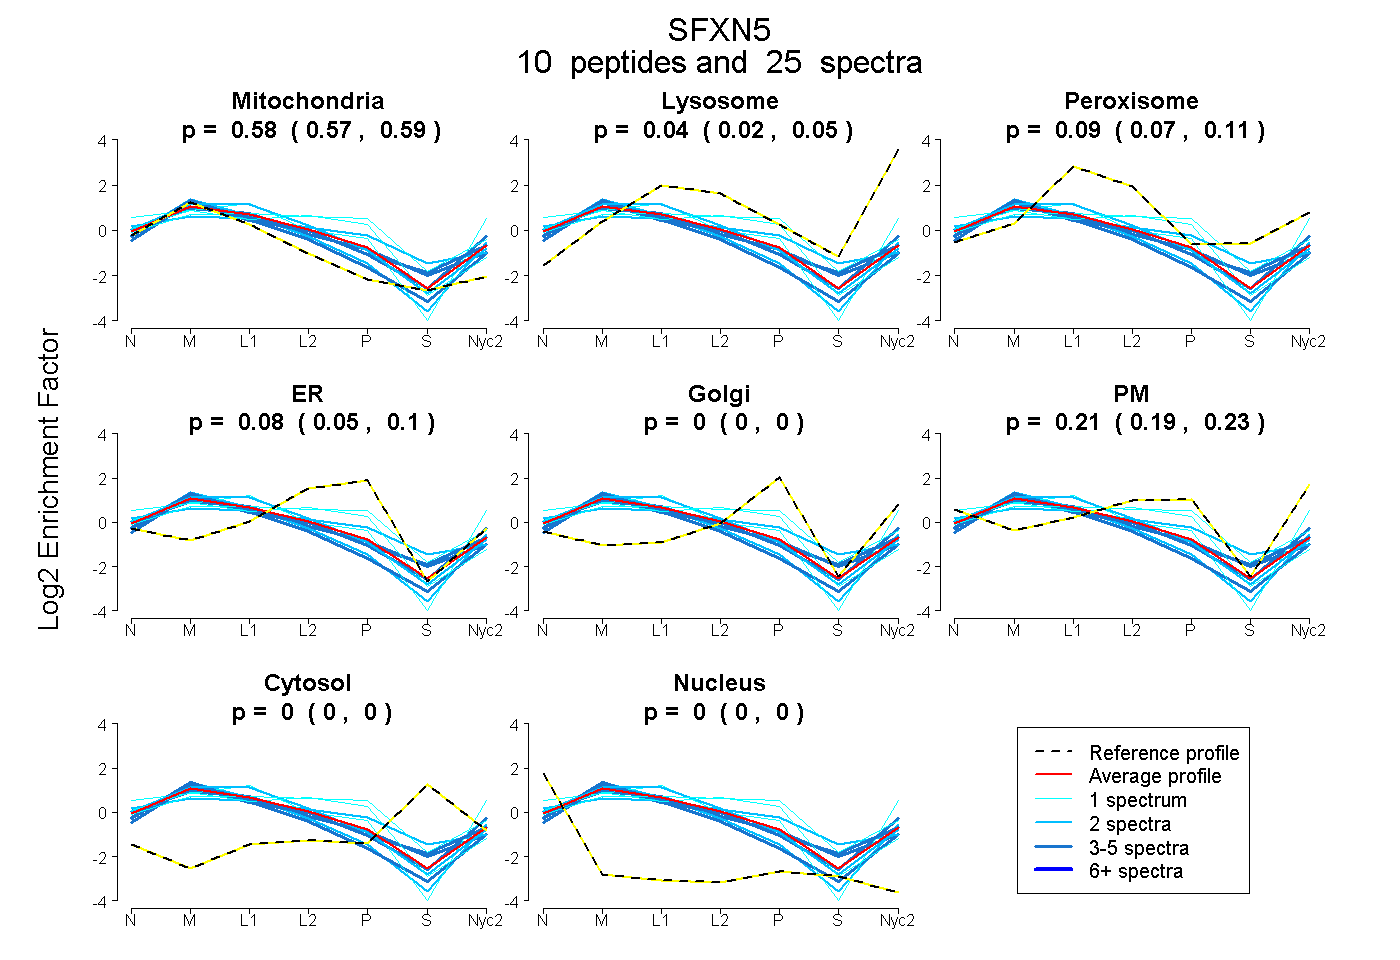
0.571 | 0.593
0.017 | 0.052
0.069 | 0.112
0.051 | 0.095
0.000 | 0.000
0.189 | 0.234
0.000 | 0.000
0.000 | 0.000
7peptides
spectra
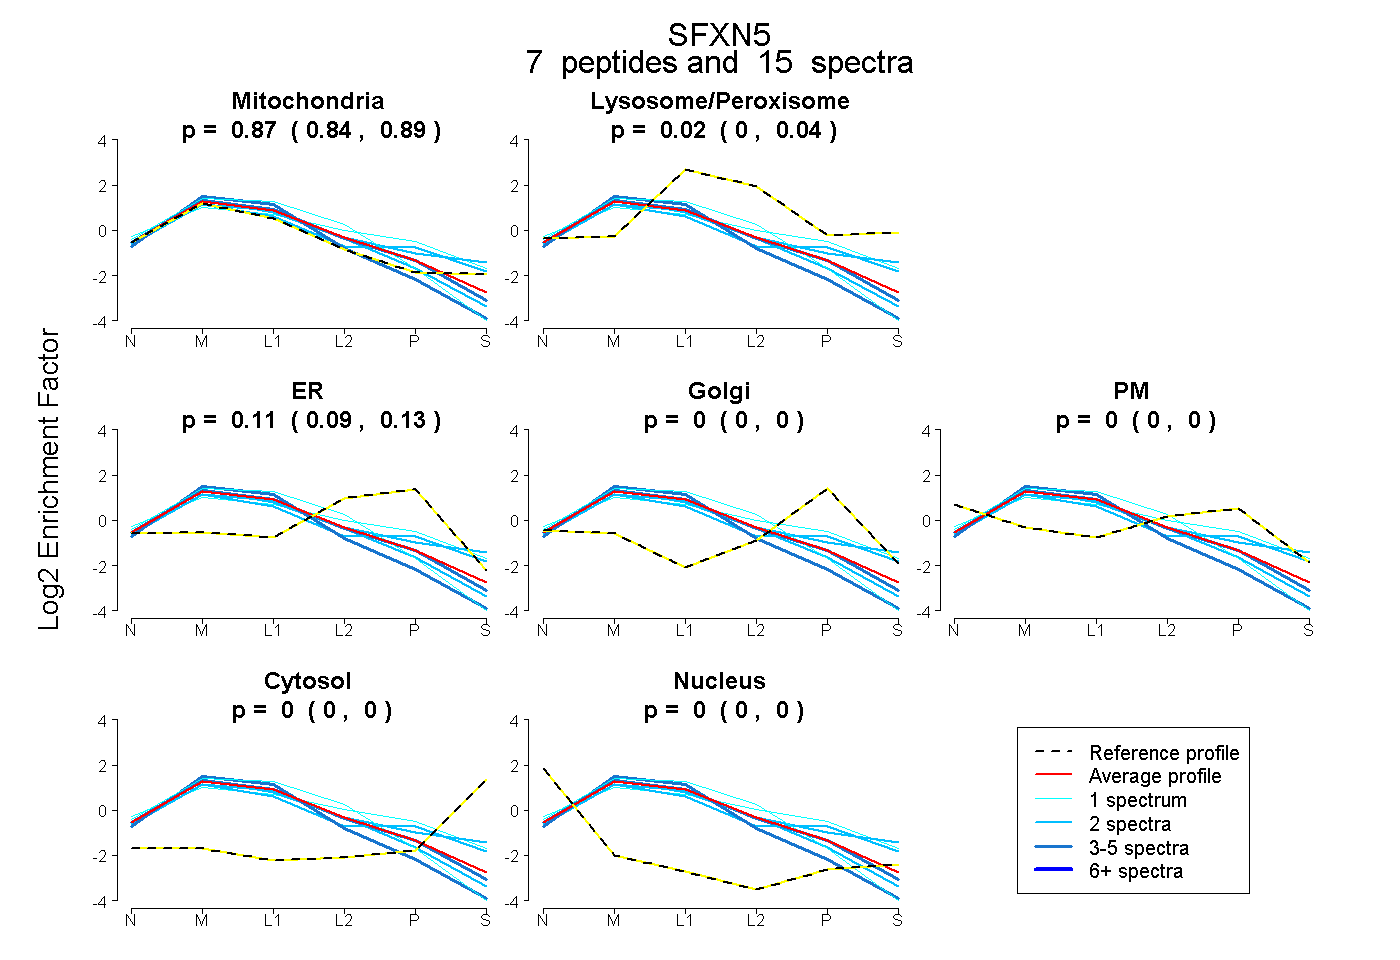
0.843 | 0.887
0.000 | 0.041
0.087 | 0.134
0.000 | 0.000
0.000 | 0.000
0.000 | 0.000
0.000 | 0.000
11peptides
spectra
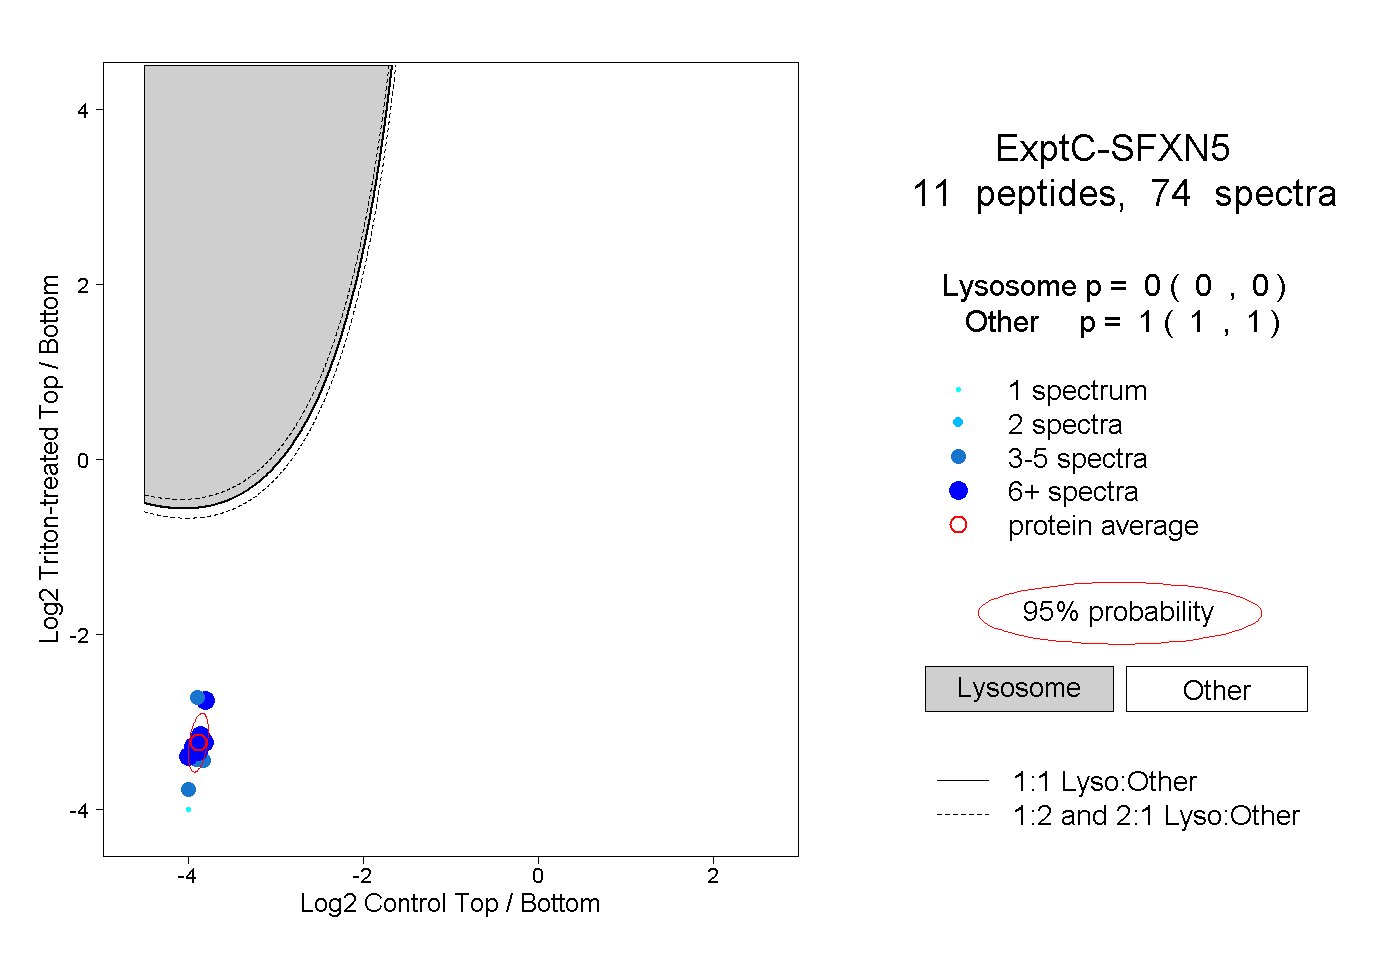
0.000 | 0.000
1.000 | 1.000
4peptides
spectra
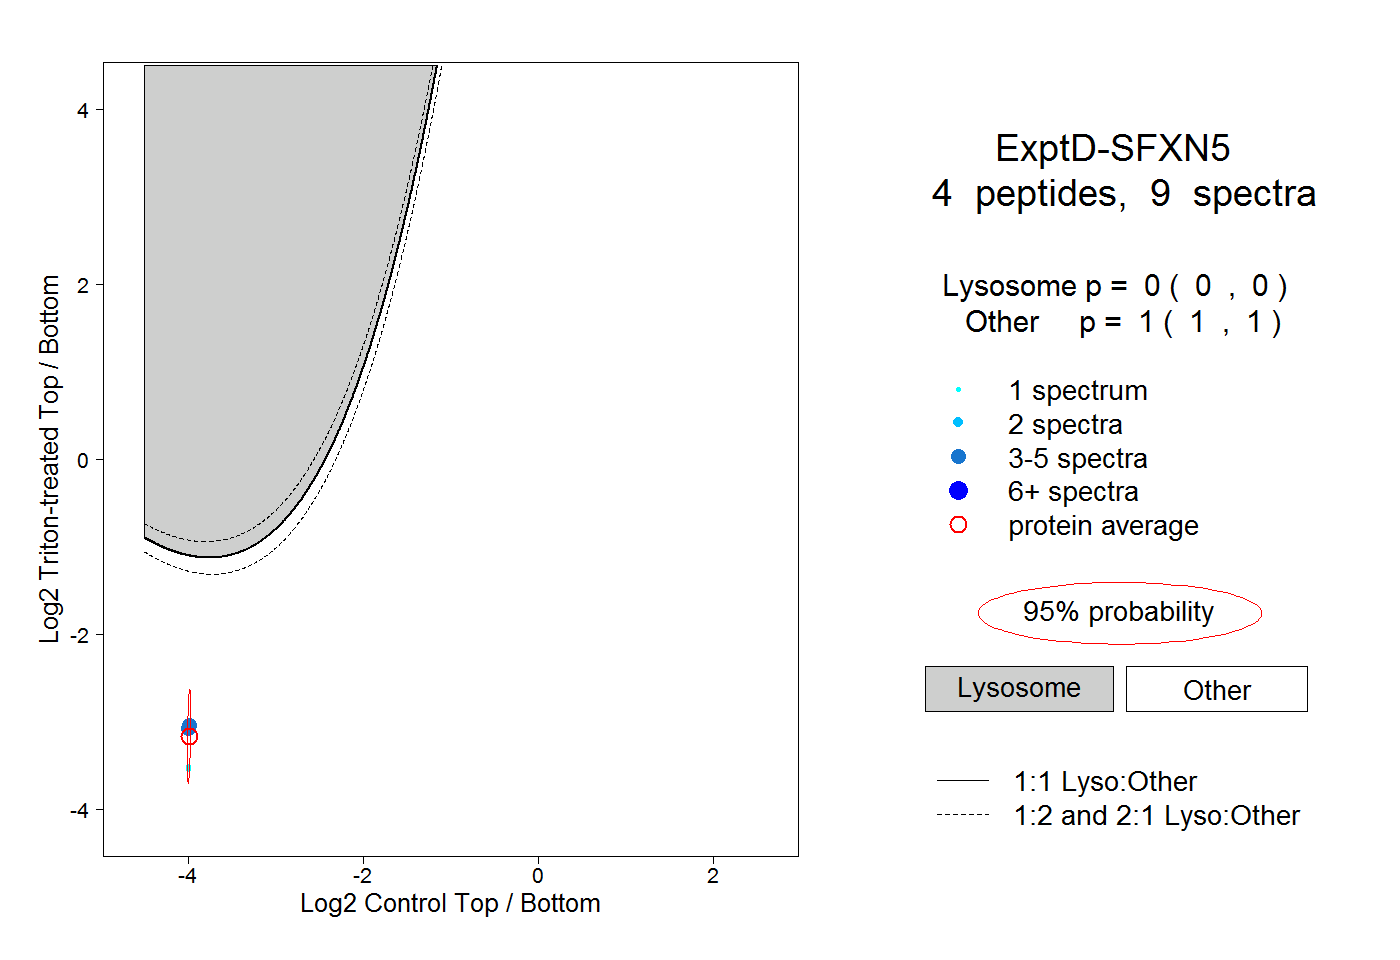
0.000 | 0.000
1.000 | 1.000