SFXN5
[ENSRNOP00000054347]
Main page
| | | Plot |
Mito |
Lyso |
|
Perox |
ER |
Golgi |
PM |
Cytosol |
Nucleus |
|
| Expt A |
 10
10
peptides |
25
spectra |
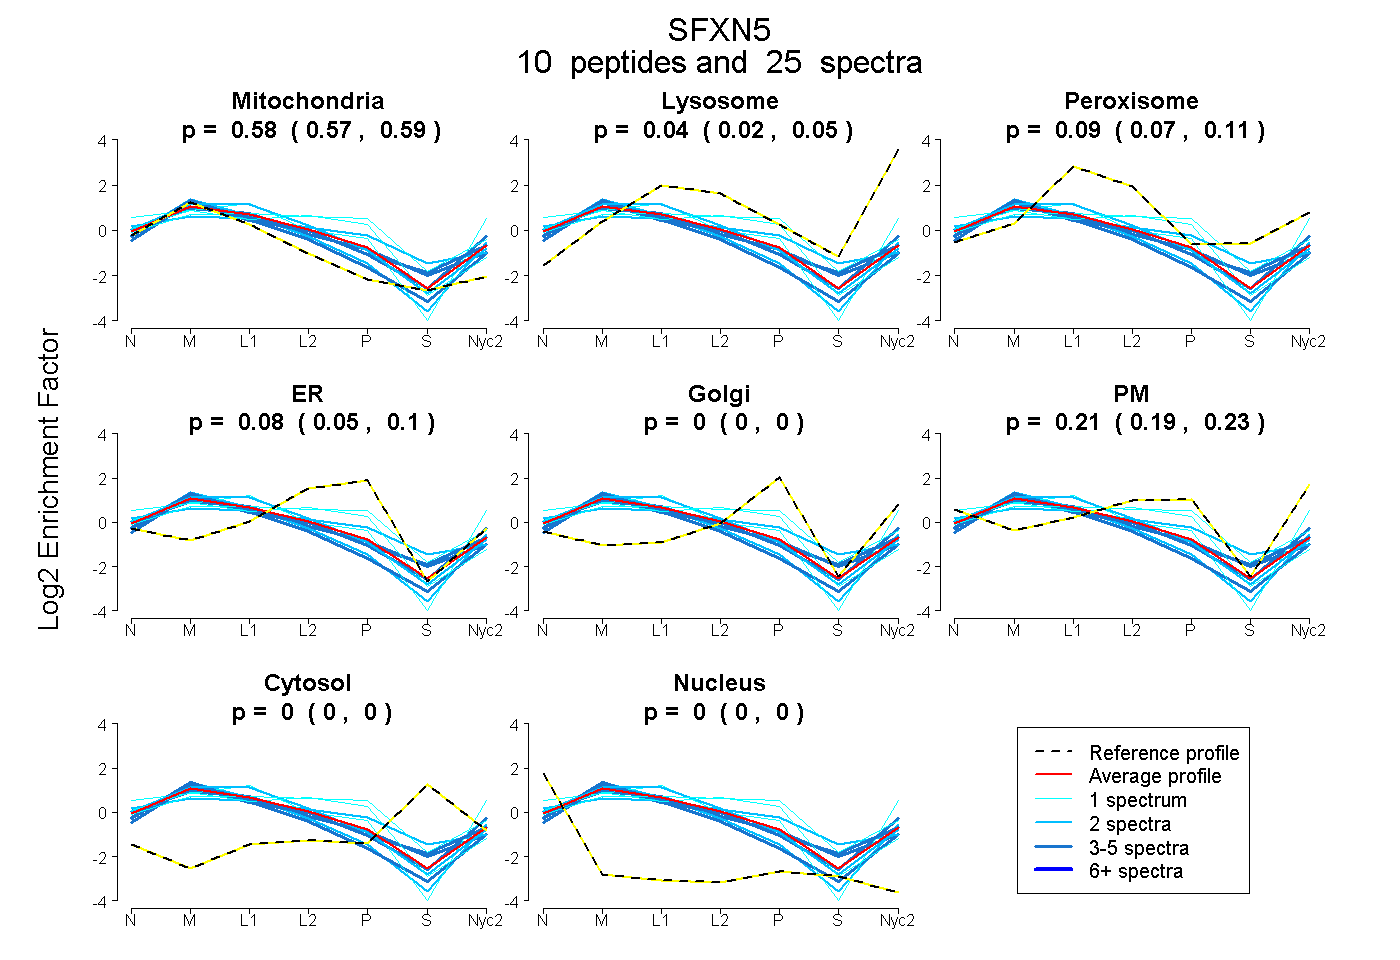 |
0.583
0.571 | 0.593 |
0.036
0.017 | 0.052 |
|
0.093
0.069 | 0.112 |
0.076
0.051 | 0.095 |
0.000
0.000 | 0.000 |
0.213
0.189 | 0.234 |
0.000
0.000 | 0.000 |
0.000
0.000 | 0.000 |
|
| | | Plot |
Mito |
|
Lyso or Perox |
|
ER |
Golgi |
PM |
Cytosol |
Nucleus |
|
| Expt B |
7
peptides |
15
spectra |
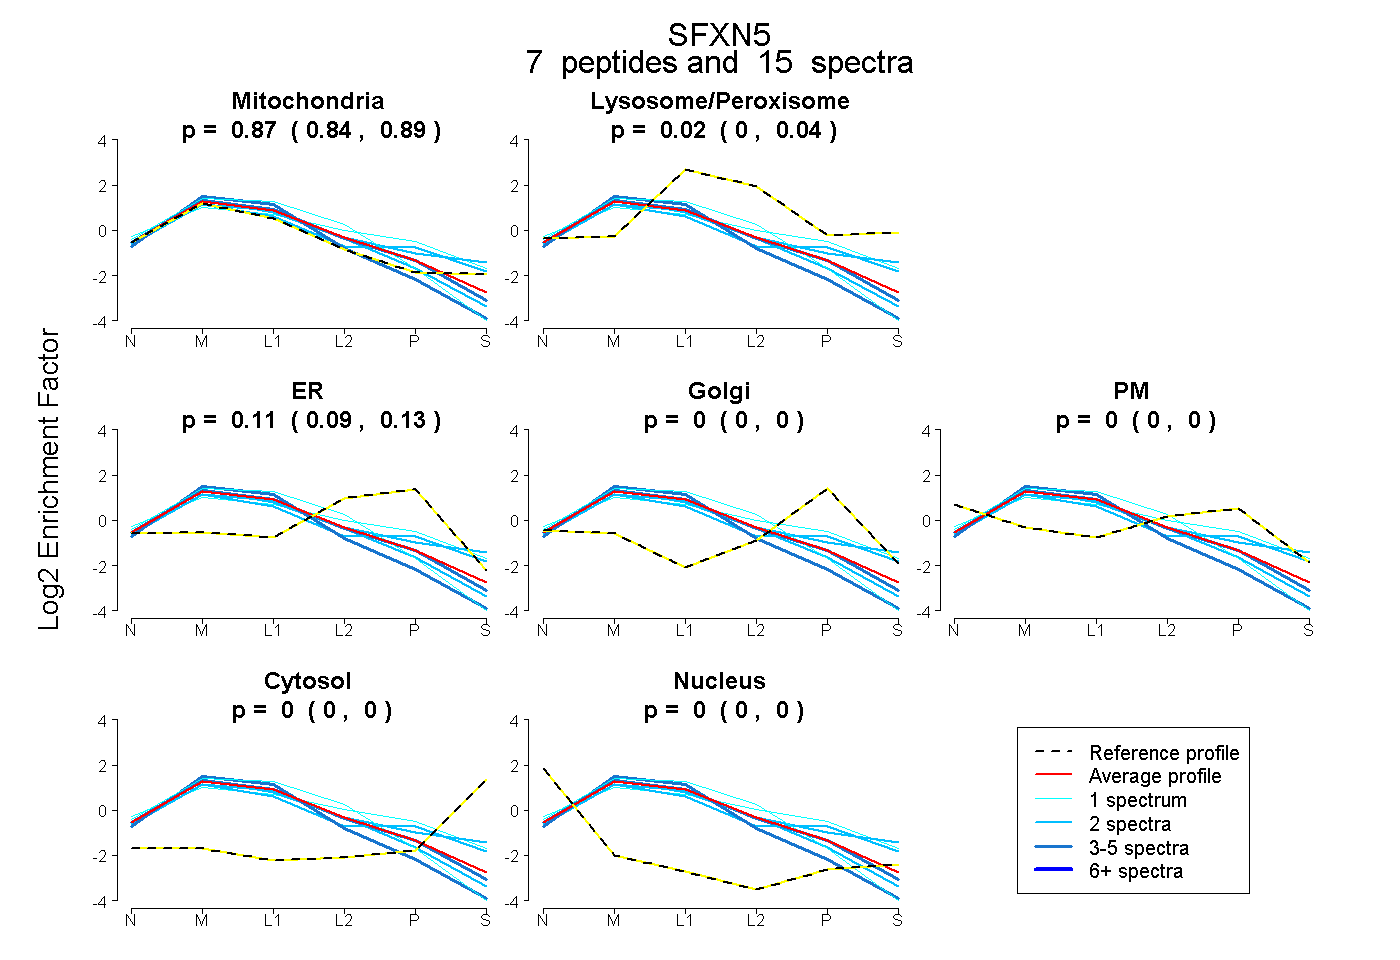 |
0.868
0.843 | 0.887 |
|
0.018
0.000 | 0.041 |
|
0.114
0.087 | 0.134 |
0.000
0.000 | 0.000 |
0.000
0.000 | 0.000 |
0.000
0.000 | 0.000 |
0.000
0.000 | 0.000 |
|
| 2 spectra, HALLETALTR |
0.715 |
|
0.212 |
|
0.000 |
0.073 |
0.000 |
0.000 |
0.000 |
|
| 2 spectra, FQQTSFYGR |
0.930 |
|
0.000 |
|
0.070 |
0.000 |
0.000 |
0.000 |
0.000 |
|
| 2 spectra, HFLDIIDPR |
0.736 |
|
0.097 |
|
0.038 |
0.129 |
0.000 |
0.000 |
0.000 |
|
| 1 spectrum, TLFVTEK |
0.904 |
|
0.001 |
|
0.096 |
0.000 |
0.000 |
0.000 |
0.000 |
|
| 3 spectra, TALLQARPR |
1.000 |
|
0.000 |
|
0.000 |
0.000 |
0.000 |
0.000 |
0.000 |
|
| 4 spectra, FTPATR |
0.883 |
|
0.000 |
|
0.117 |
0.000 |
0.000 |
0.000 |
0.000 |
|
| 1 spectrum, EAVQLLEDYK |
0.567 |
|
0.173 |
|
0.173 |
0.000 |
0.087 |
0.000 |
0.000 |
|
| | | Plot |
|
Lyso |
|
|
|
|
|
|
|
Other |
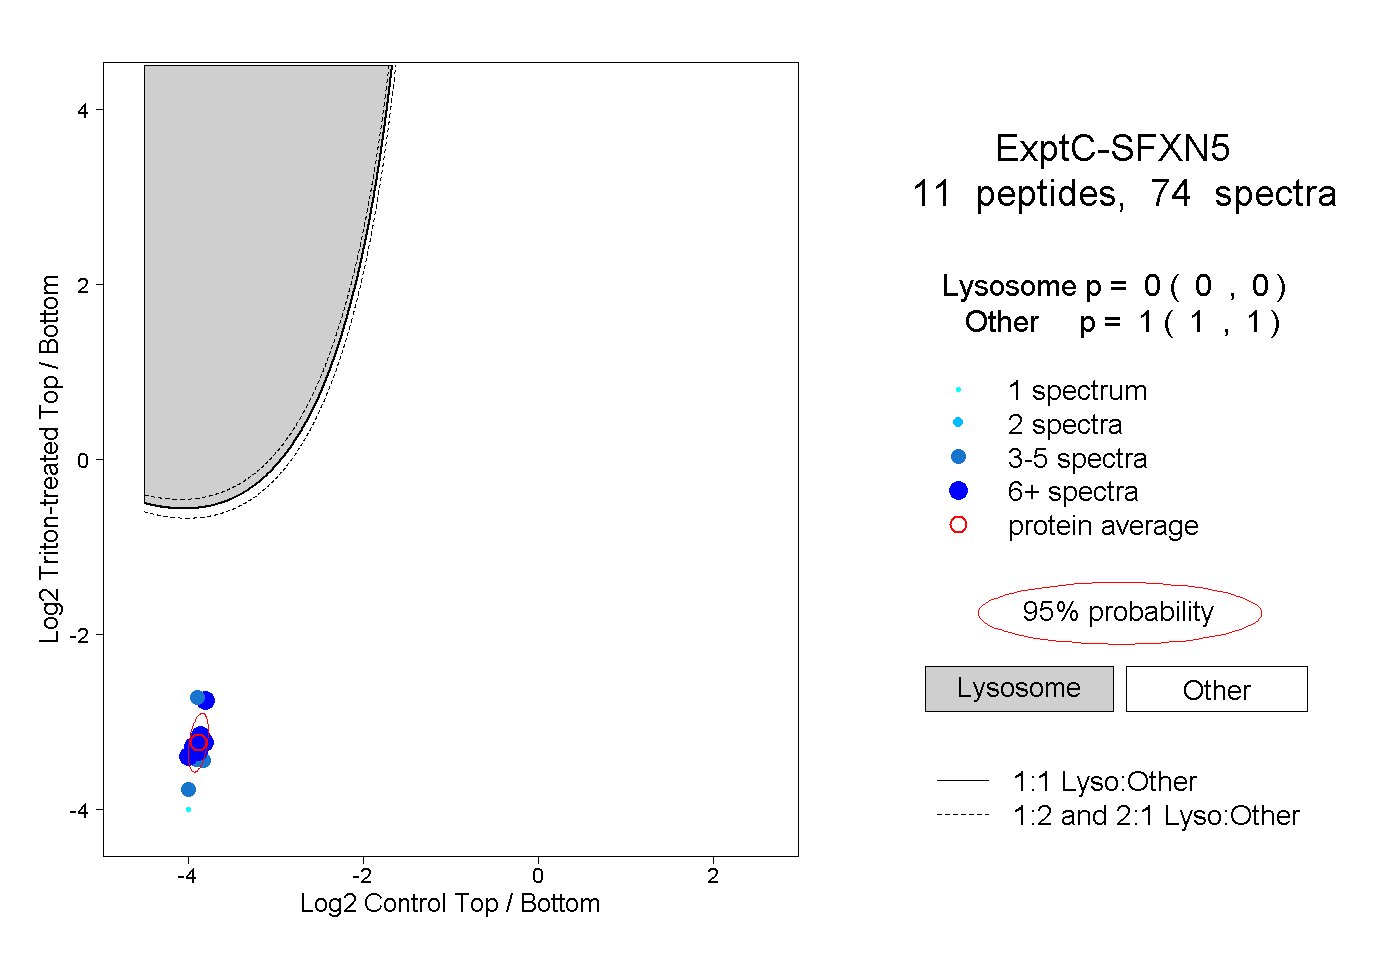
| Expt C |
11
peptides |
74
spectra |
 |
|
0.000
0.000 | 0.000 |
|
|
|
|
|
|
|
1.000
1.000 | 1.000 |
| | | Plot |
|
Lyso |
|
|
|
|
|
|
|
Other |
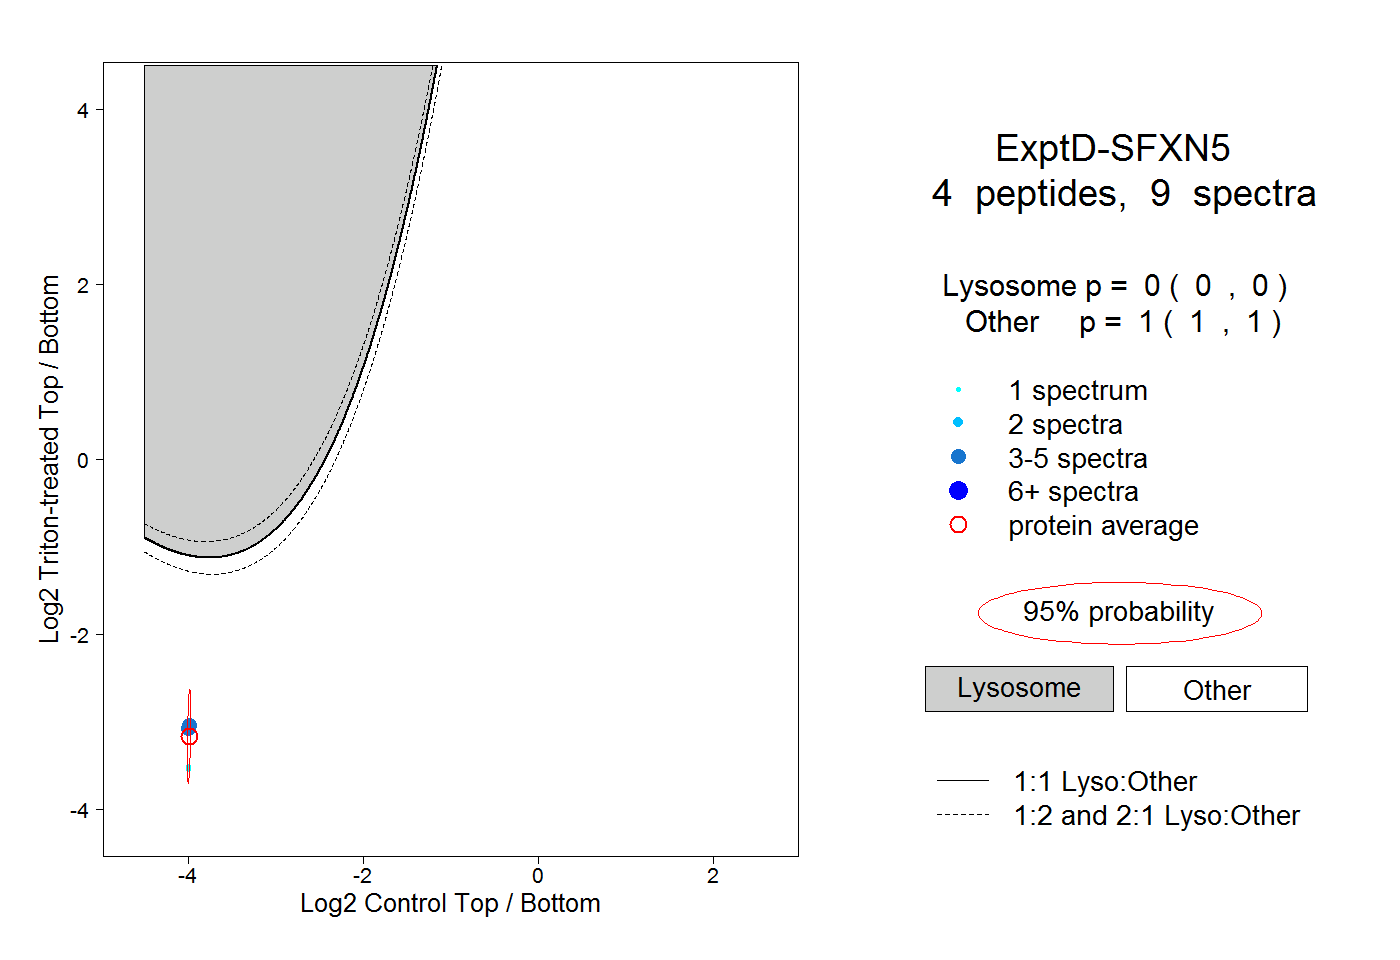
| Expt D |
4
peptides |
9
spectra |
 |
|
0.000
0.000 | 0.000 |
|
|
|
|
|
|
|
1.000
1.000 | 1.000 |