 2
2peptides
spectra
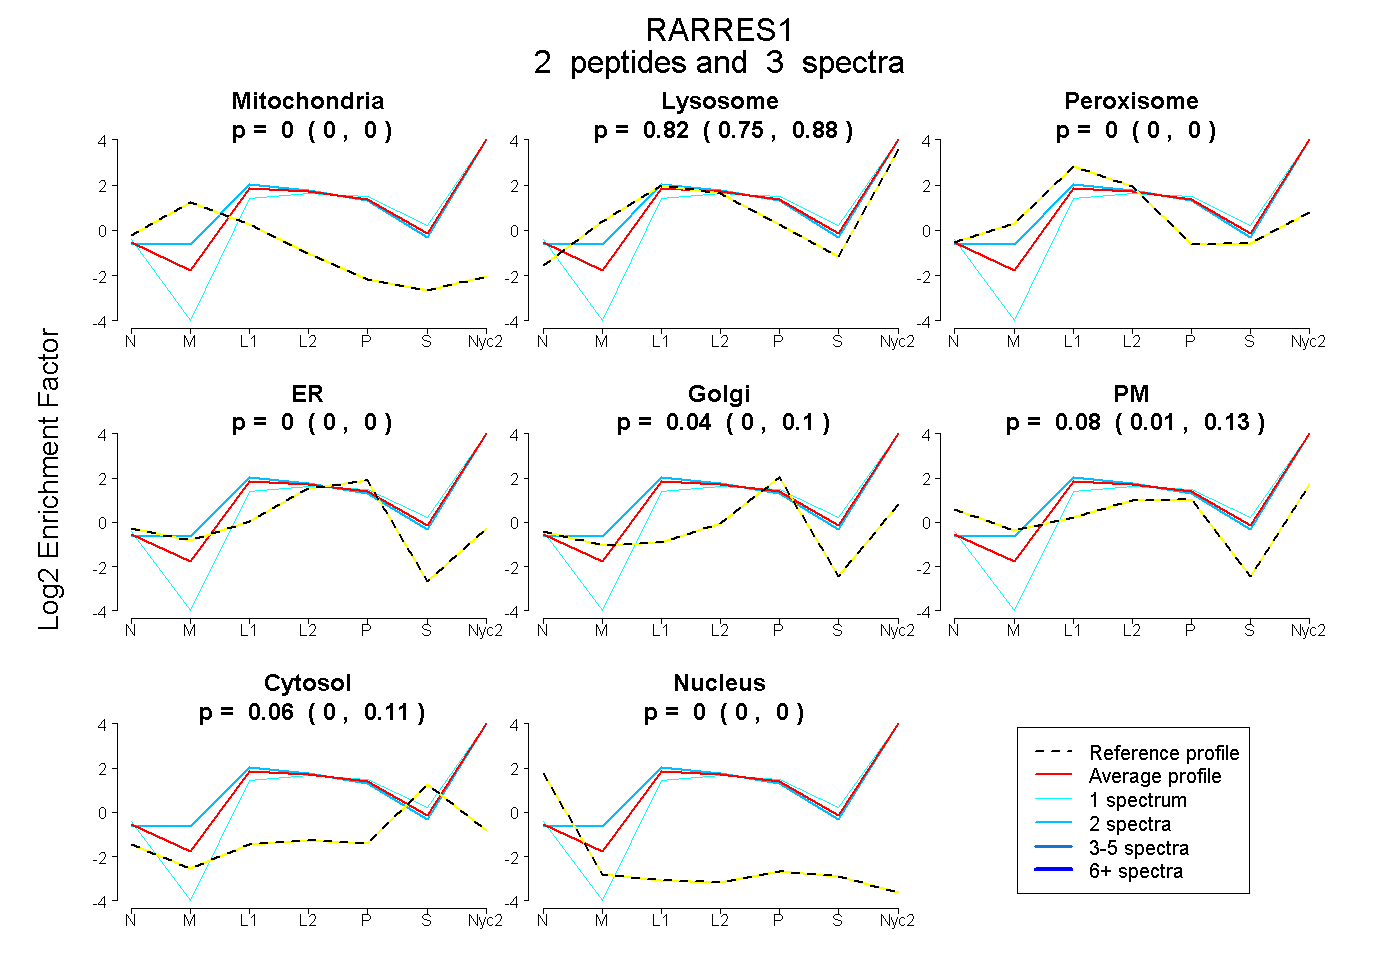
0.000 | 0.000
0.749 | 0.880
0.000 | 0.000
0.000 | 0.000
0.000 | 0.099
0.013 | 0.128
0.000 | 0.111
0.000 | 0.000
1peptide
spectra
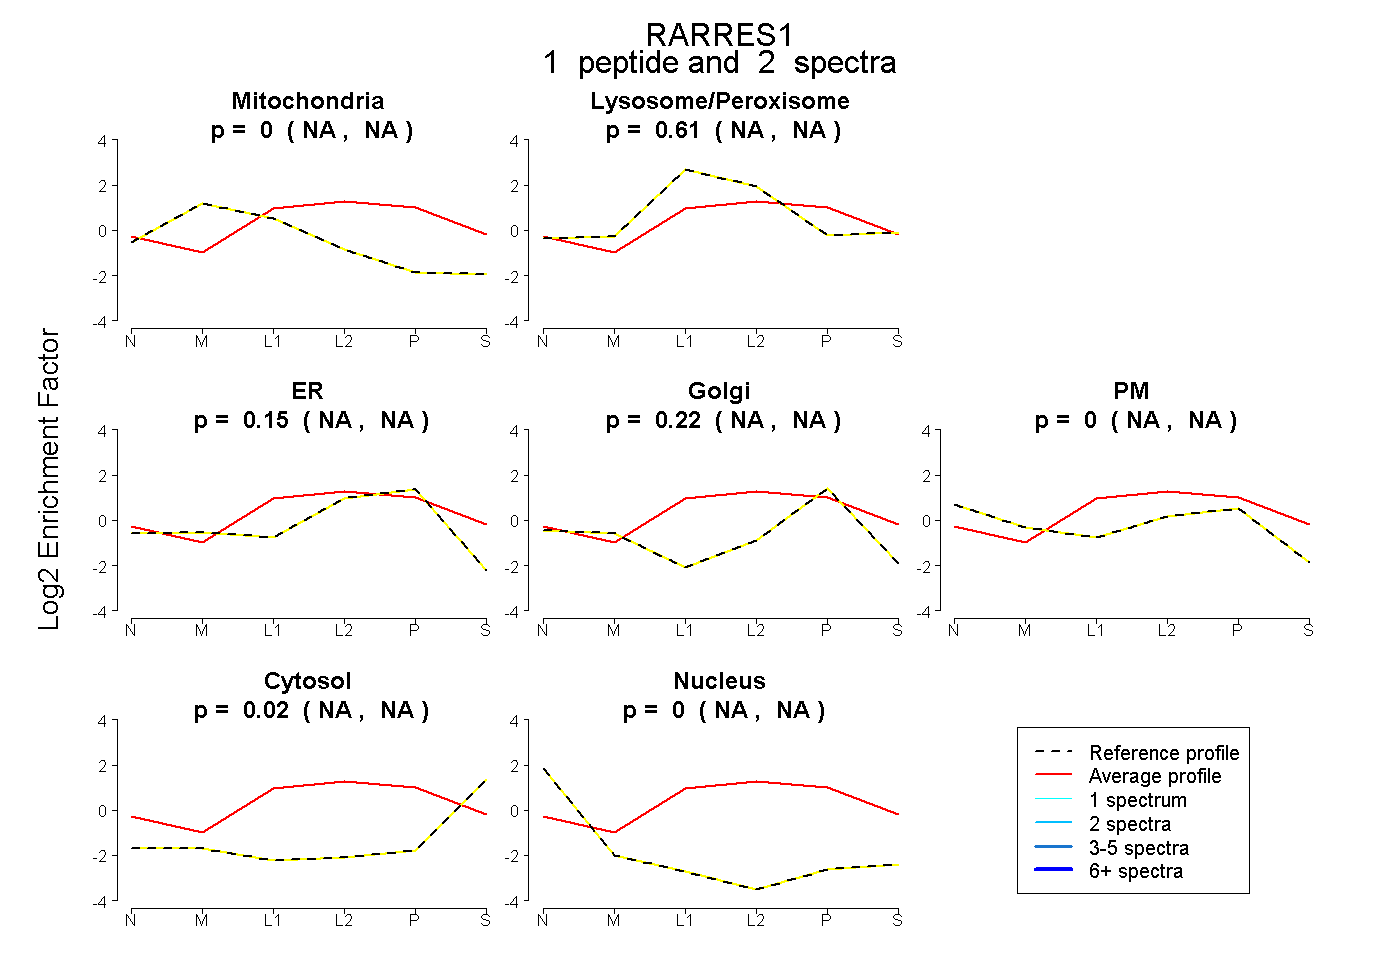
NA | NA
NA | NA
NA | NA
NA | NA
NA | NA
NA | NA
NA | NA
4peptides
spectra
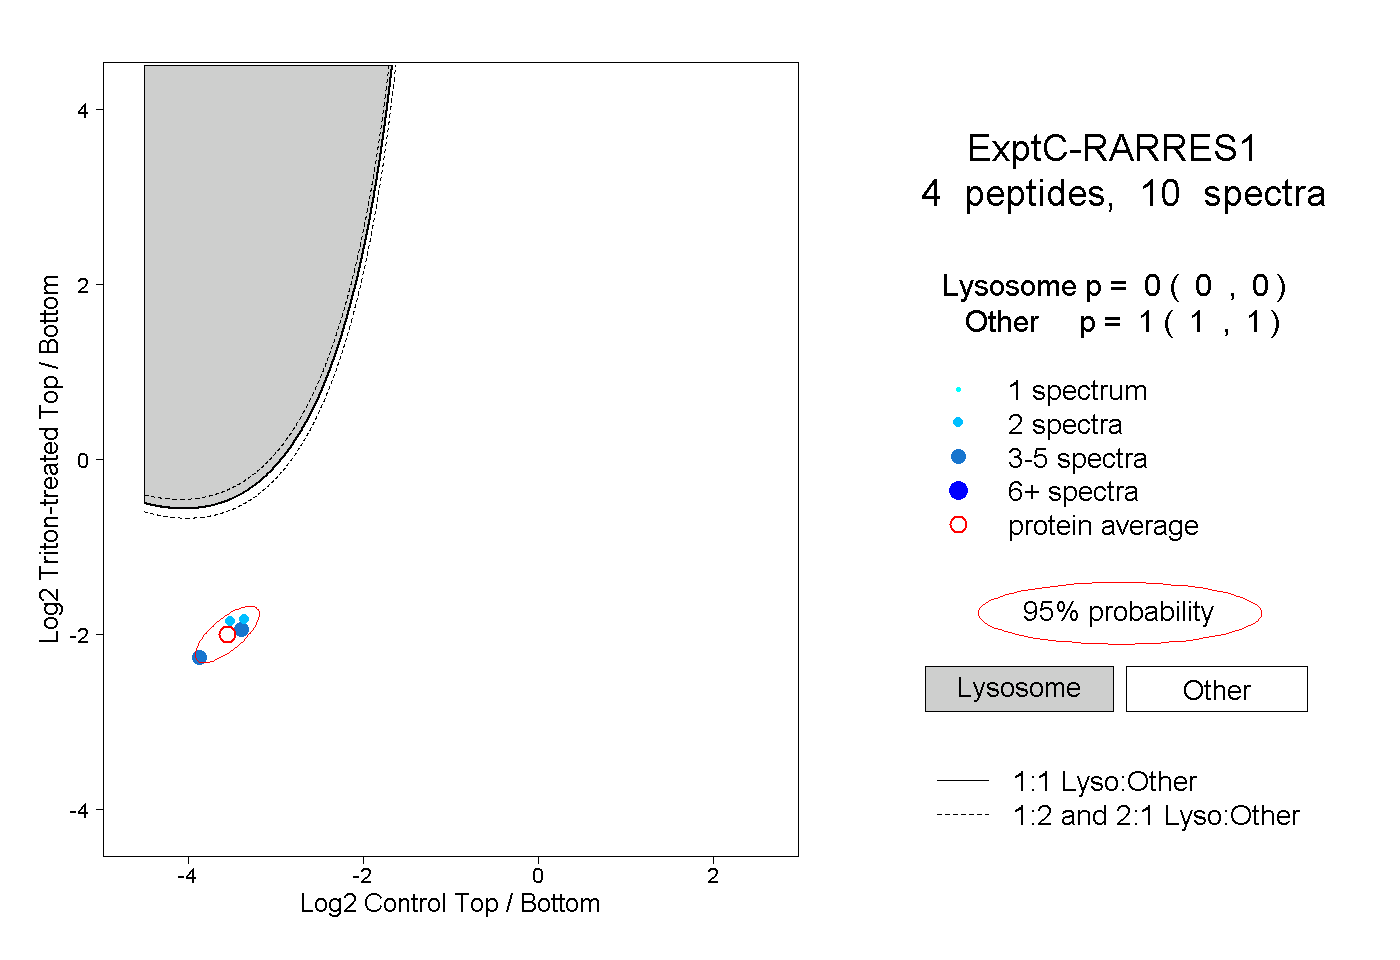
0.000 | 0.000
1.000 | 1.000
2peptides
spectra

0.000 | 0.000
1.000 | 1.000