 2
2peptides
spectra
0.000 | 0.000
0.749 | 0.880
0.000 | 0.000
0.000 | 0.000
0.000 | 0.099
0.013 | 0.128
0.000 | 0.111
0.000 | 0.000
| Plot | Mito | Lyso | Perox | ER | Golgi | PM | Cytosol | Nucleus | |||||
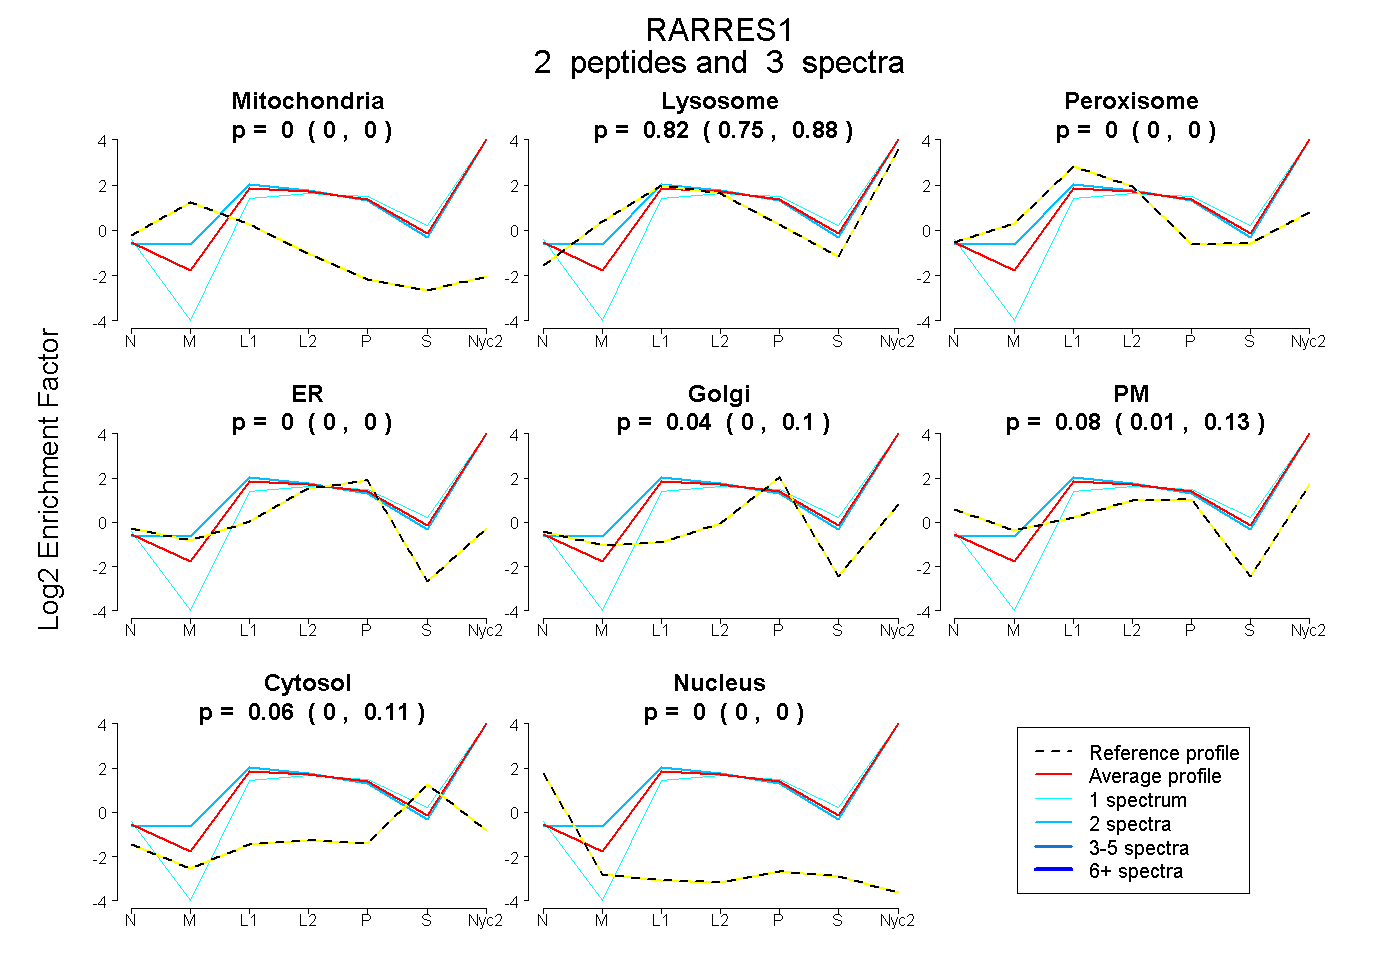
| Expt A |
2 peptides |
3 spectra |
|
0.000 0.000 | 0.000 |
0.822 0.749 | 0.880 |
0.000 0.000 | 0.000 |
0.000 0.000 | 0.000 |
0.039 0.000 | 0.099 |
0.081 0.013 | 0.128 |
0.058 0.000 | 0.111 |
0.000 0.000 | 0.000 |
| 1 spectrum, AALHFLNFR | 0.000 | 0.669 | 0.000 | 0.000 | 0.122 | 0.014 | 0.195 | 0.000 | ||
| 2 spectra, AGSPSALR | 0.000 | 0.899 | 0.000 | 0.000 | 0.000 | 0.101 | 0.000 | 0.000 |
| Plot | Mito | Lyso or Perox | ER | Golgi | PM | Cytosol | Nucleus | ||||||
| Expt B |
1 peptide |
2 spectra |
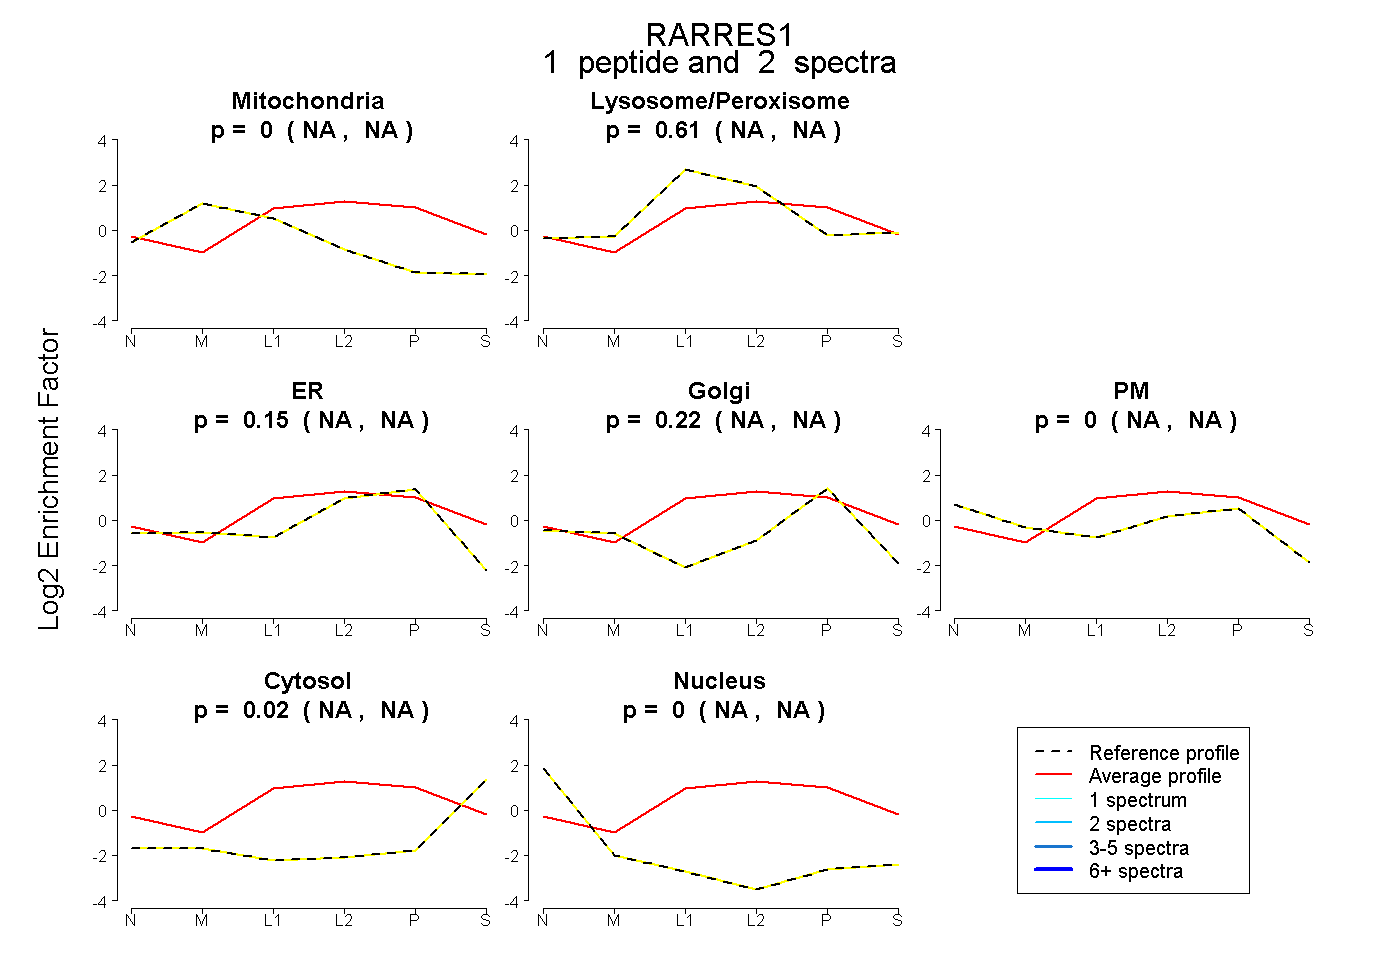 |
0.000 NA | NA |
0.610 NA | NA |
0.149 NA | NA |
0.215 NA | NA |
0.000 NA | NA |
0.025 NA | NA |
0.000 NA | NA |
|||
| Plot | Lyso | Other | |||||||||||
| Expt C |
4 peptides |
10 spectra |
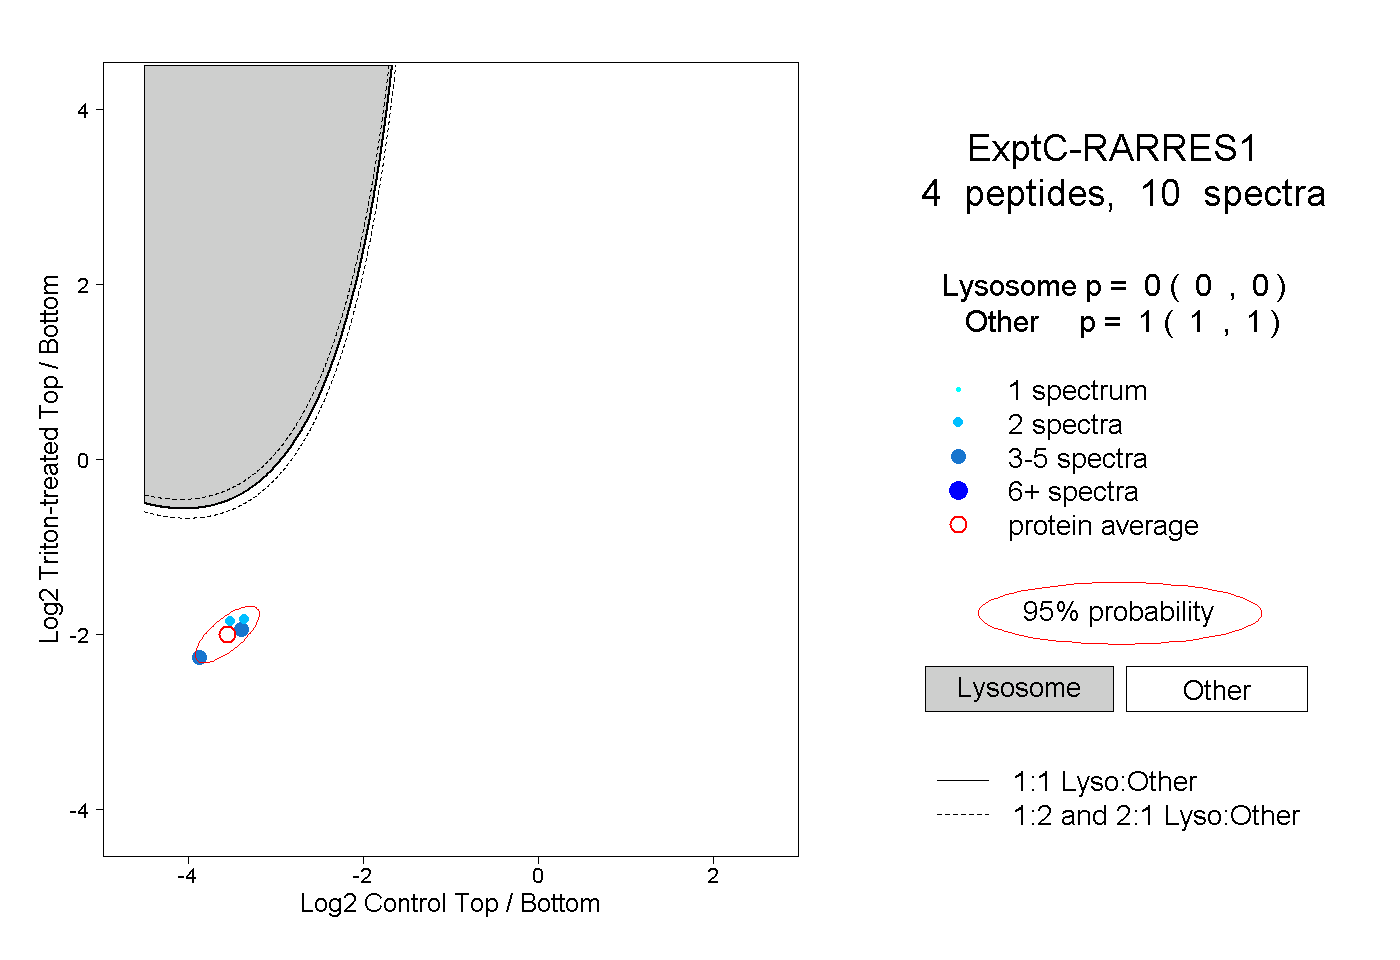 |
0.000 0.000 | 0.000 |
1.000 1.000 | 1.000 |
||||||||
| Plot | Lyso | Other | |||||||||||
| Expt D |
2 peptides |
3 spectra |
 |
0.000 0.000 | 0.000 |
1.000 1.000 | 1.000 |