 11
11peptides
spectra
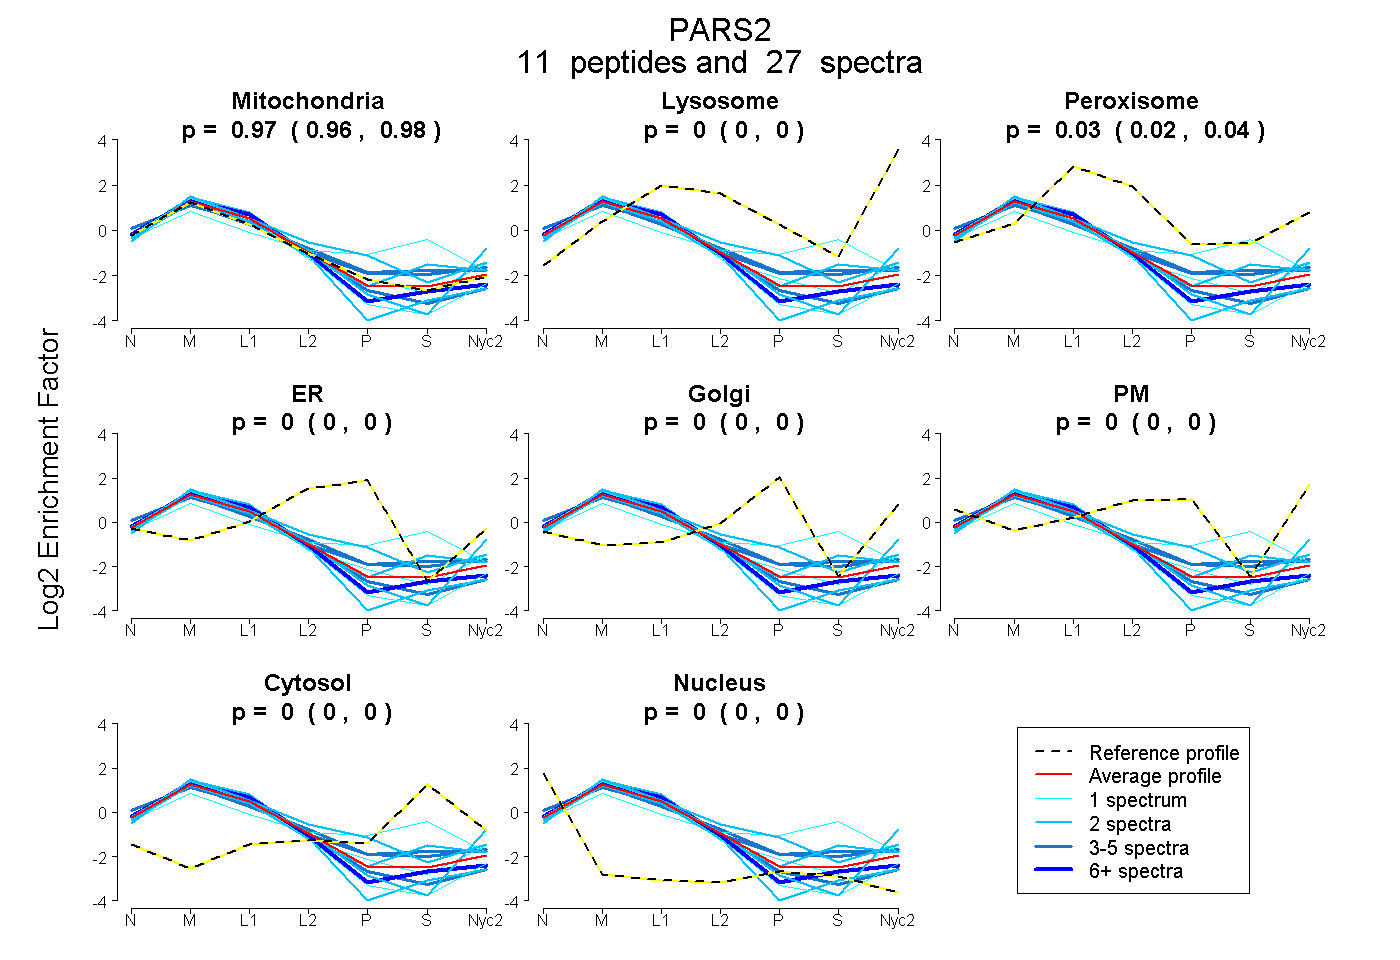
0.960 | 0.980
0.000 | 0.000
0.018 | 0.038
0.000 | 0.000
0.000 | 0.000
0.000 | 0.000
0.000 | 0.000
0.000 | 0.000
3peptides
spectra
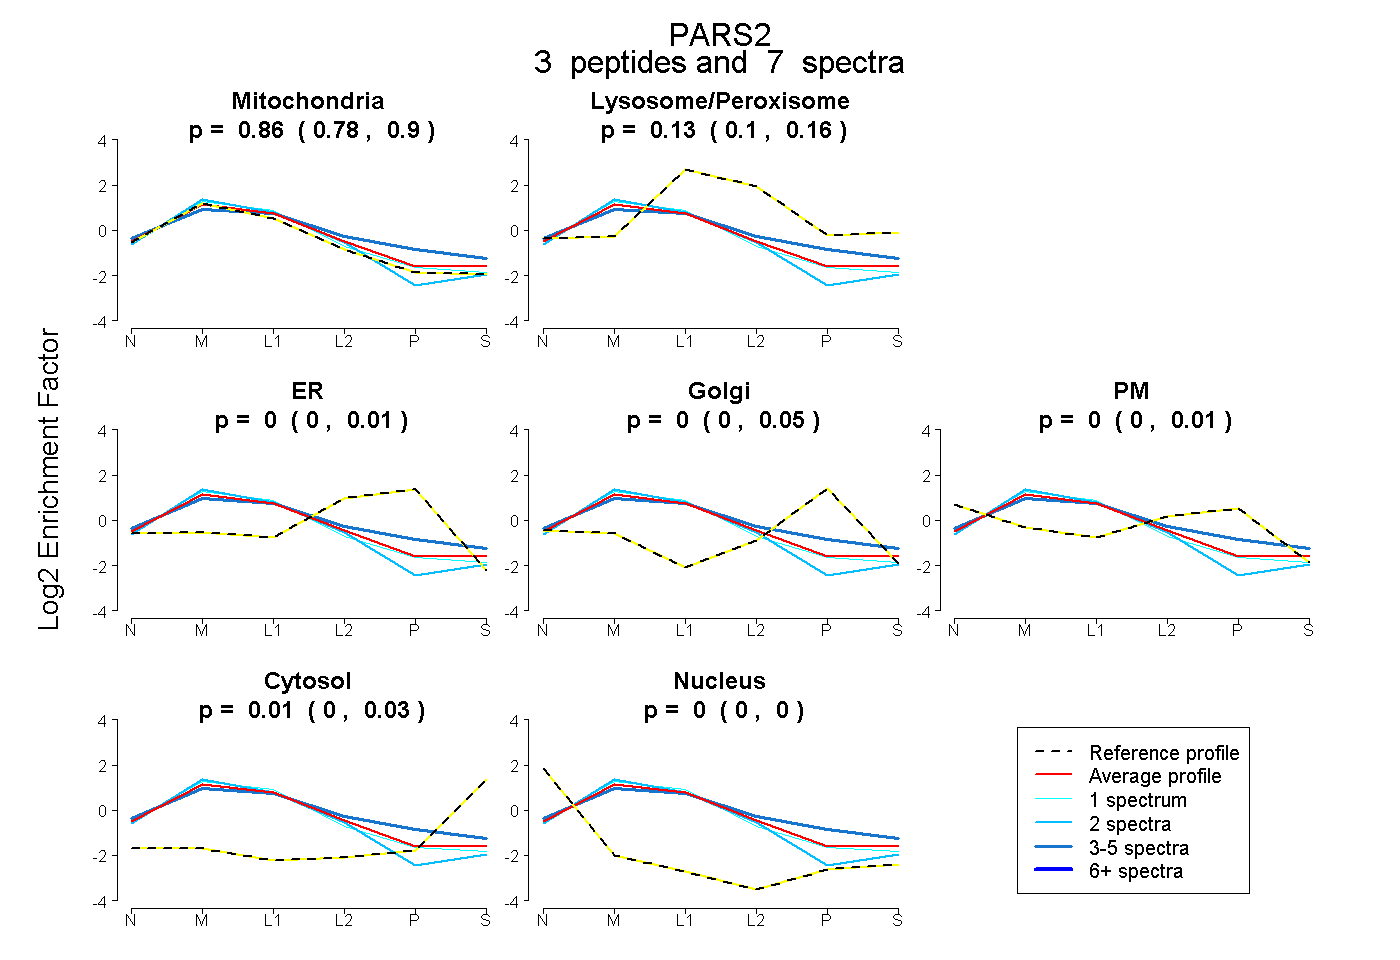
0.782 | 0.896
0.096 | 0.160
0.000 | 0.013
0.000 | 0.047
0.000 | 0.007
0.000 | 0.027
0.000 | 0.000
14peptides
spectra
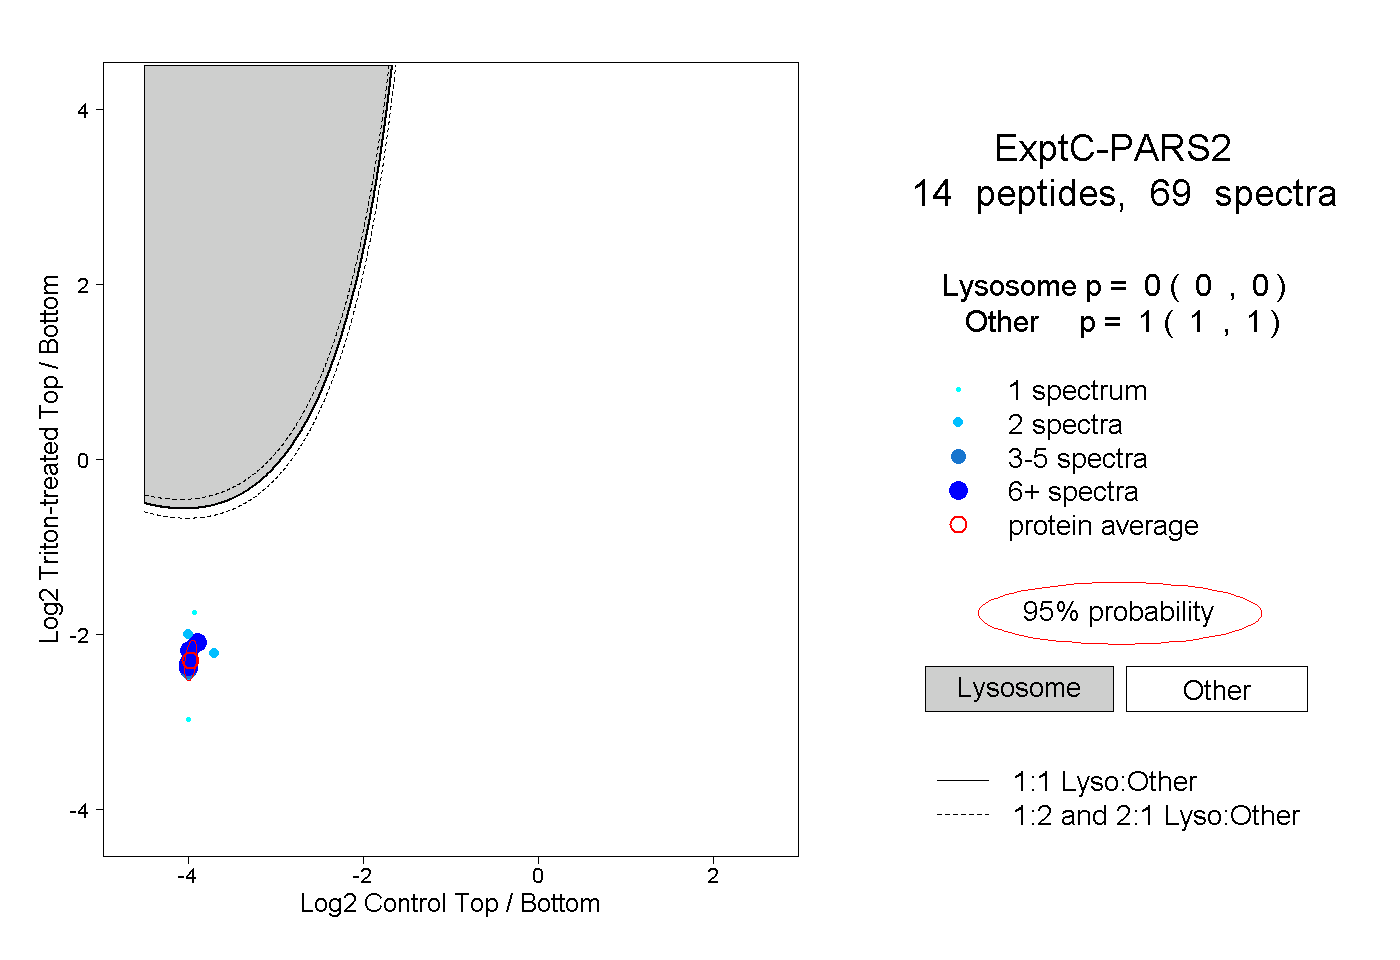
0.000 | 0.000
1.000 | 1.000
3peptides
spectra
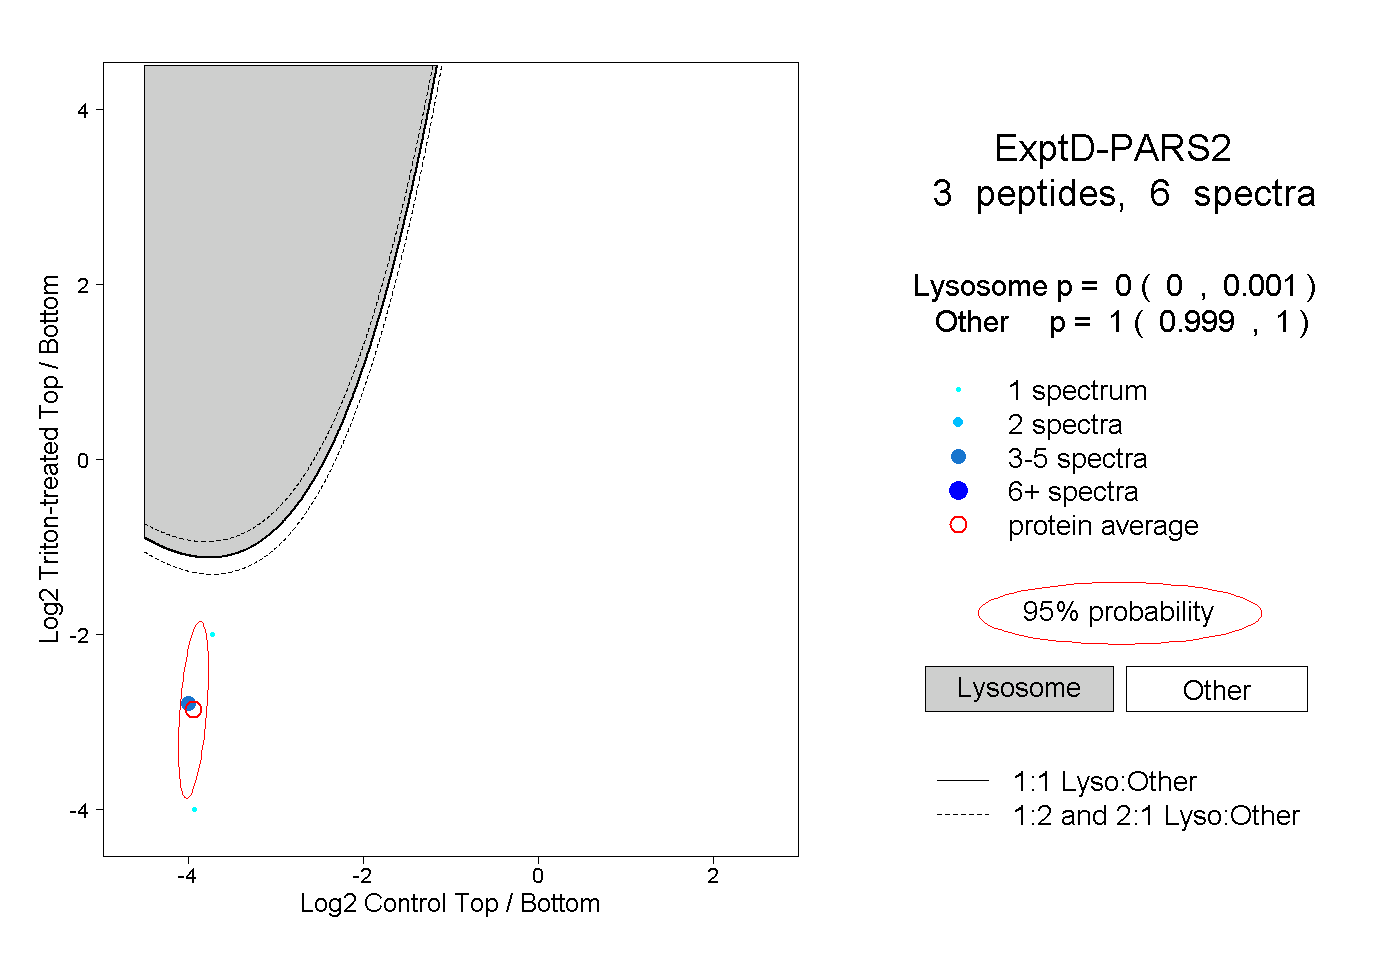
0.000 | 0.001
0.999 | 1.000