 11
11peptides
spectra
0.960 | 0.980
0.000 | 0.000
0.018 | 0.038
0.000 | 0.000
0.000 | 0.000
0.000 | 0.000
0.000 | 0.000
0.000 | 0.000
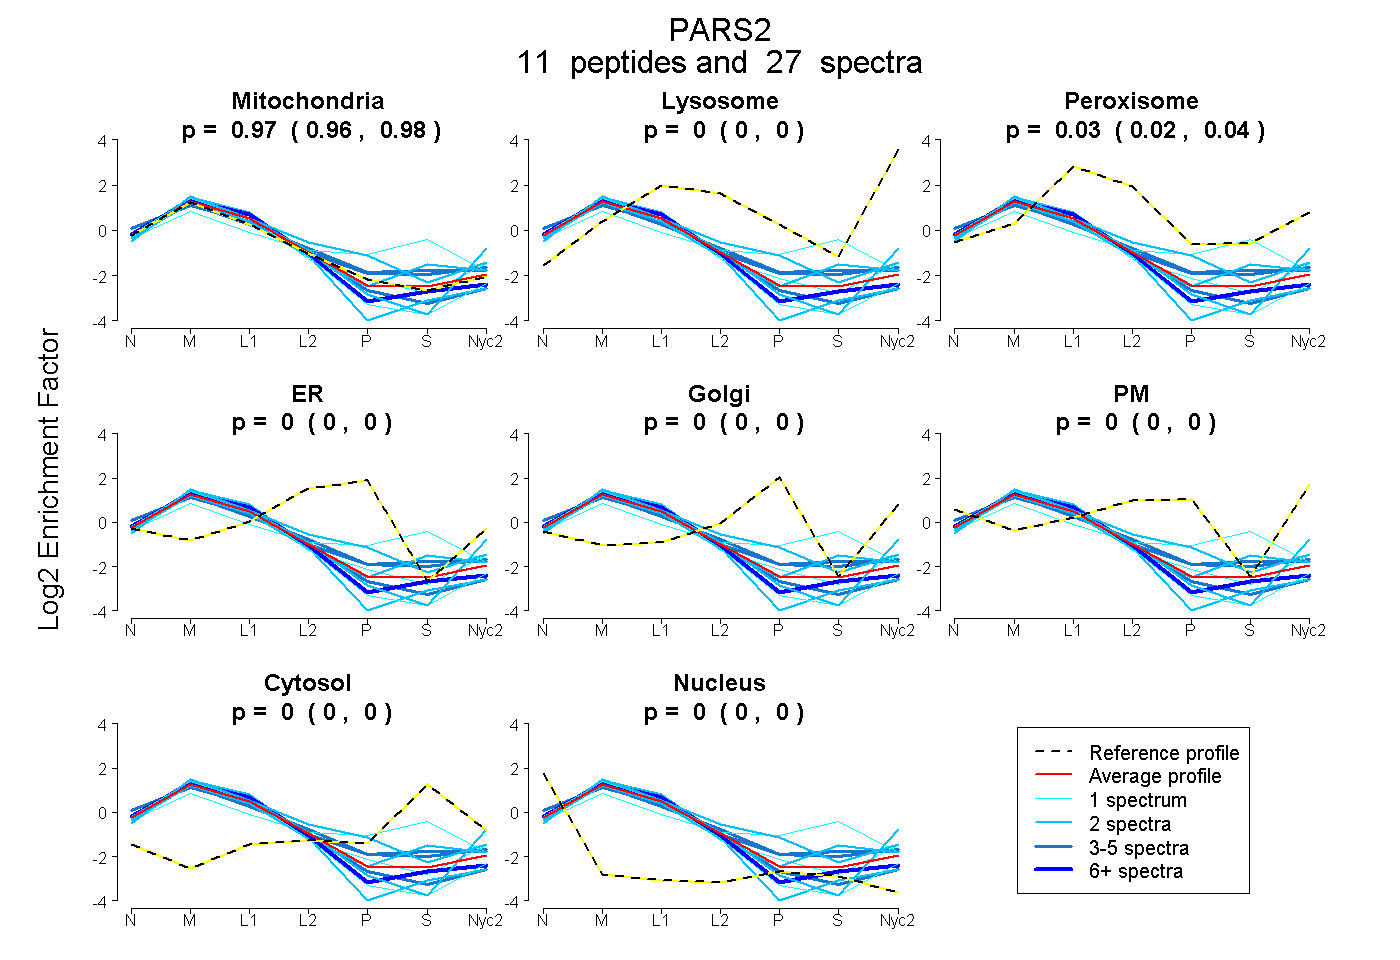
| Plot | Mito | Lyso | Perox | ER | Golgi | PM | Cytosol | Nucleus | |||||
| Expt A |
11 peptides |
27 spectra |
|
0.971 0.960 | 0.980 |
0.000 0.000 | 0.000 |
0.029 0.018 | 0.038 |
0.000 0.000 | 0.000 |
0.000 0.000 | 0.000 |
0.000 0.000 | 0.000 |
0.000 0.000 | 0.000 |
0.000 0.000 | 0.000 |
| 1 spectrum, ICPDCQGPLTETK | 0.586 | 0.000 | 0.109 | 0.004 | 0.000 | 0.000 | 0.300 | 0.000 | ||
| 4 spectra, GEVLLDDR | 0.823 | 0.000 | 0.092 | 0.000 | 0.000 | 0.000 | 0.085 | 0.000 | ||
| 2 spectra, WDLMGR | 0.912 | 0.088 | 0.000 | 0.000 | 0.000 | 0.000 | 0.000 | 0.000 | ||
| 3 spectra, ADVGSIGGTMSHEFQLPVDIGEDR | 1.000 | 0.000 | 0.000 | 0.000 | 0.000 | 0.000 | 0.000 | 0.000 | ||
| 2 spectra, VIDQEMQAIGGQK | 0.741 | 0.002 | 0.116 | 0.070 | 0.071 | 0.000 | 0.000 | 0.000 | ||
| 3 spectra, EAAATEIVER | 0.832 | 0.000 | 0.098 | 0.000 | 0.000 | 0.003 | 0.050 | 0.017 | ||
| 1 spectrum, QLPLLLYQVTR | 0.996 | 0.000 | 0.000 | 0.000 | 0.000 | 0.000 | 0.000 | 0.004 | ||
| 1 spectrum, GIEVGHTFYLGTK | 0.941 | 0.059 | 0.000 | 0.000 | 0.000 | 0.000 | 0.000 | 0.000 | ||
| 6 spectra, LGYPFVIIASK | 1.000 | 0.000 | 0.000 | 0.000 | 0.000 | 0.000 | 0.000 | 0.000 | ||
| 2 spectra, INMPSLSPAELWR | 0.846 | 0.000 | 0.039 | 0.000 | 0.000 | 0.000 | 0.115 | 0.000 | ||
| 2 spectra, EGVMELLTGVHVV | 1.000 | 0.000 | 0.000 | 0.000 | 0.000 | 0.000 | 0.000 | 0.000 |
| Plot | Mito | Lyso or Perox | ER | Golgi | PM | Cytosol | Nucleus | ||||||
| Expt B |
3 peptides |
7 spectra |
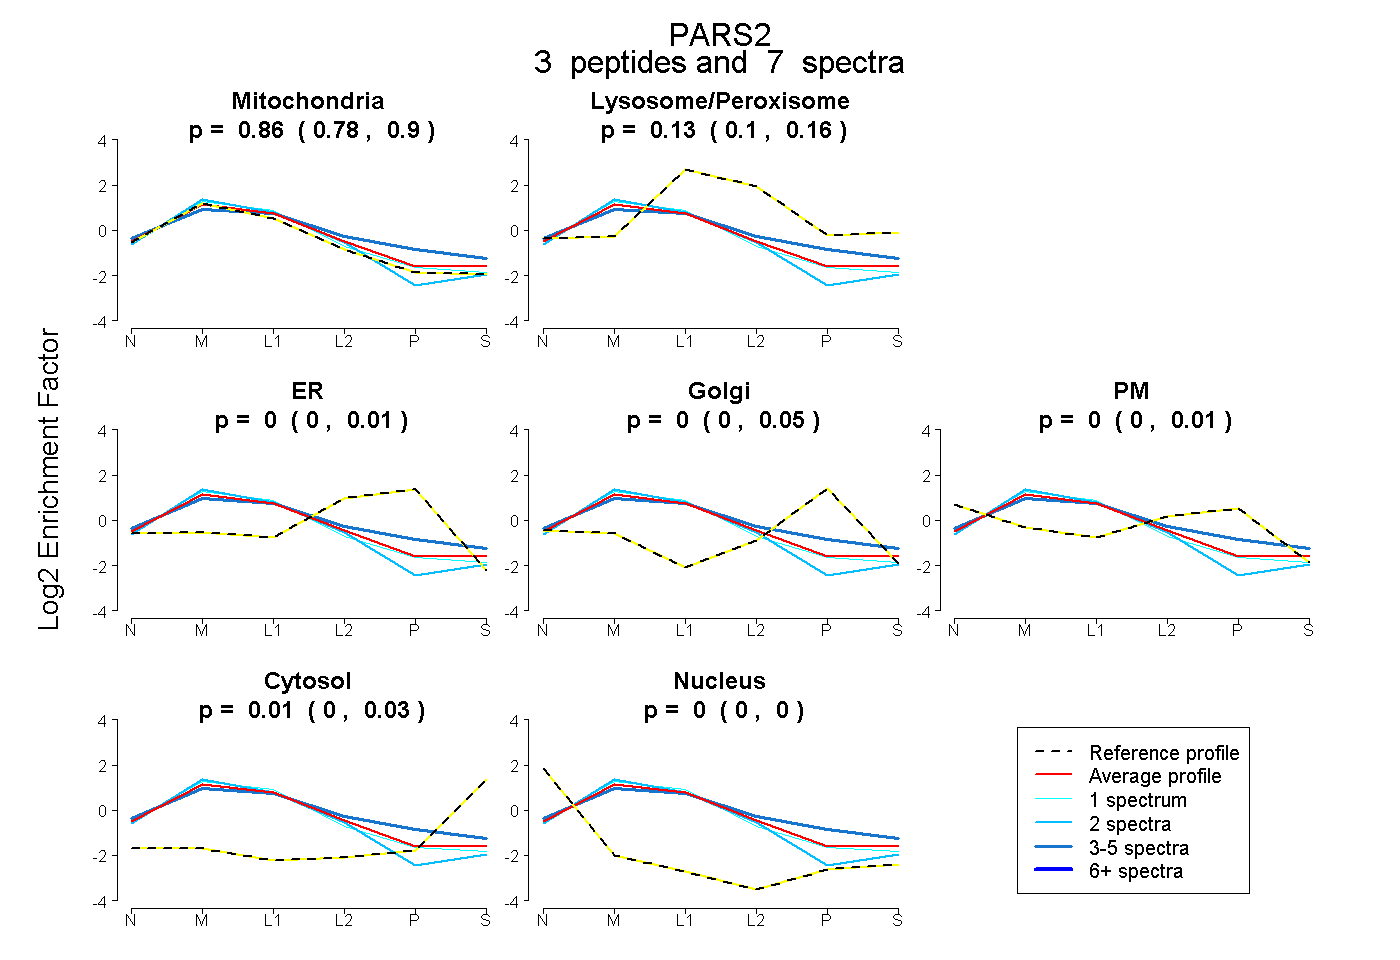 |
0.860 0.782 | 0.896 |
0.132 0.096 | 0.160 |
0.000 0.000 | 0.013 |
0.000 0.000 | 0.047 |
0.000 0.000 | 0.007 |
0.007 0.000 | 0.027 |
0.000 0.000 | 0.000 |
|||
| Plot | Lyso | Other | |||||||||||
| Expt C |
14 peptides |
69 spectra |
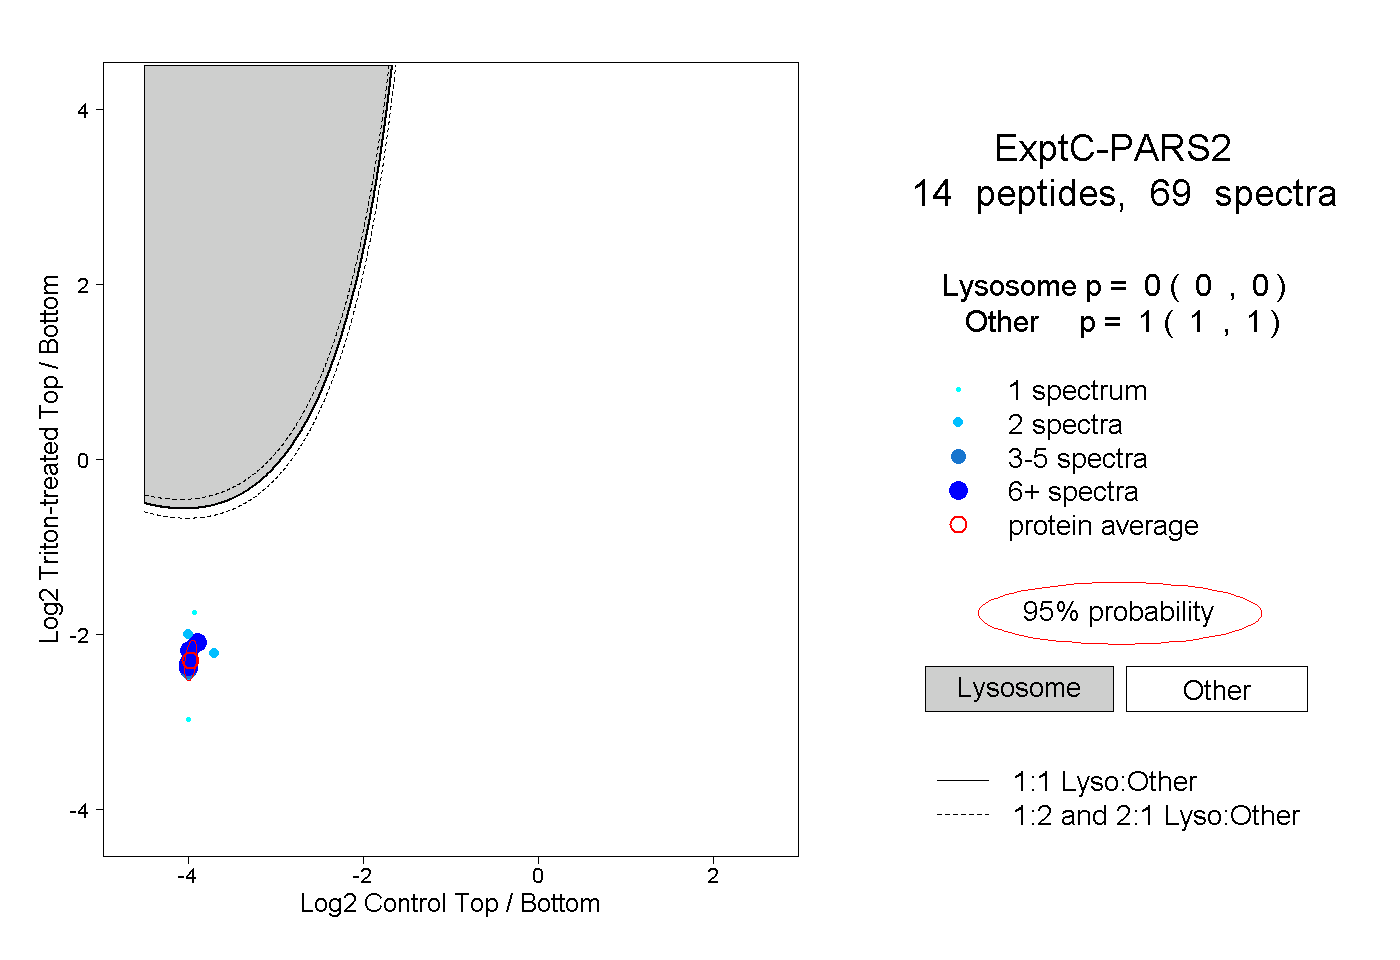 |
0.000 0.000 | 0.000 |
1.000 1.000 | 1.000 |
||||||||
| Plot | Lyso | Other | |||||||||||
| Expt D |
3 peptides |
6 spectra |
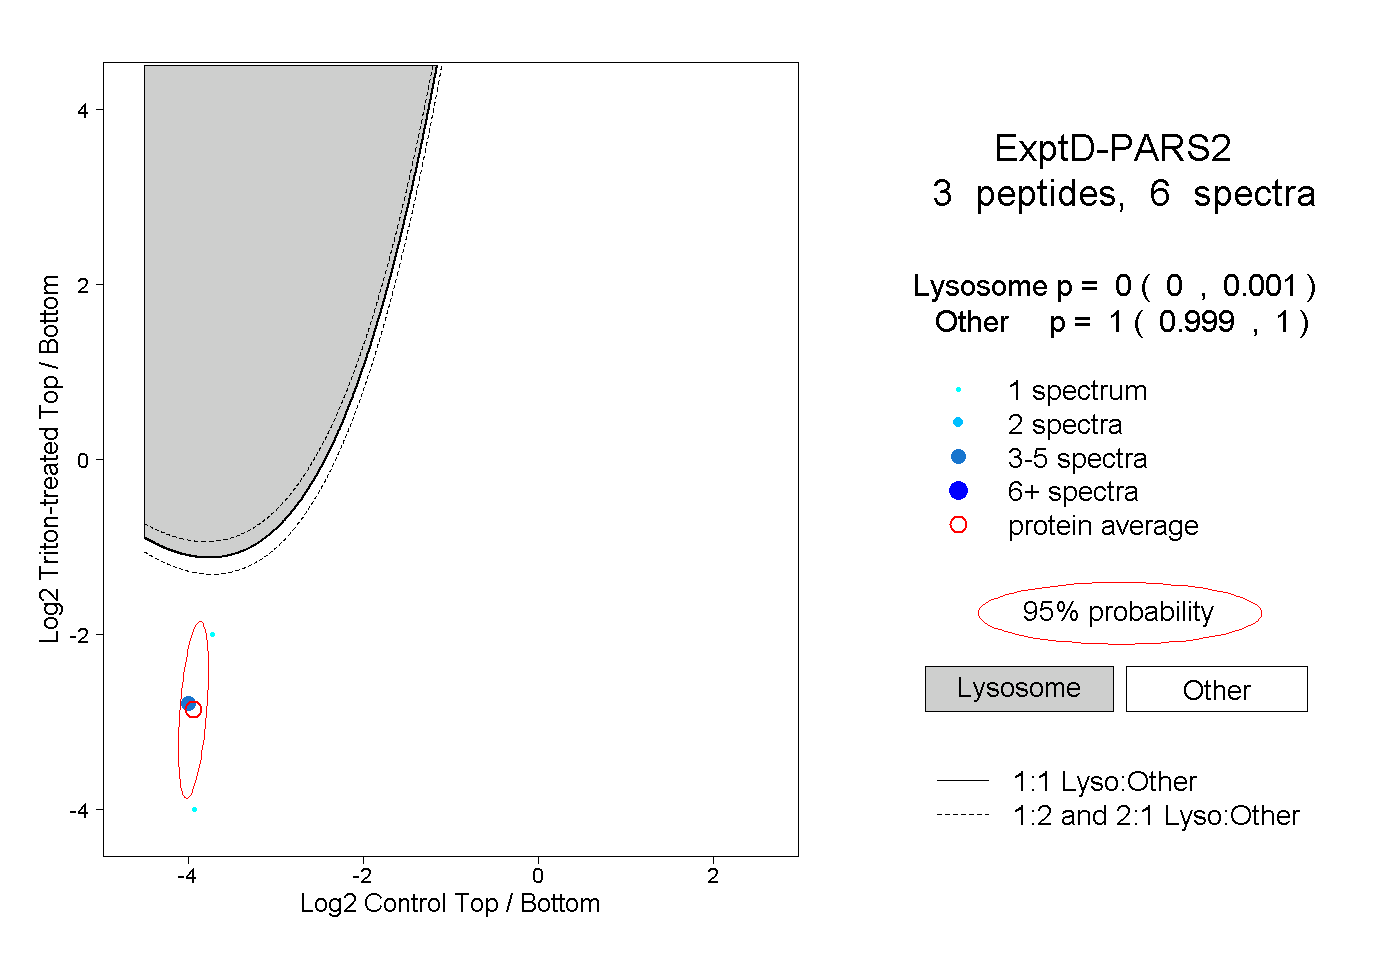 |
0.000 0.000 | 0.001 |
1.000 0.999 | 1.000 |