 8
8peptides
spectra

0.000 | 0.000
0.920 | 0.944
0.000 | 0.000
0.000 | 0.000
0.000 | 0.000
0.000 | 0.000
0.054 | 0.078
0.000 | 0.000
12peptides
spectra
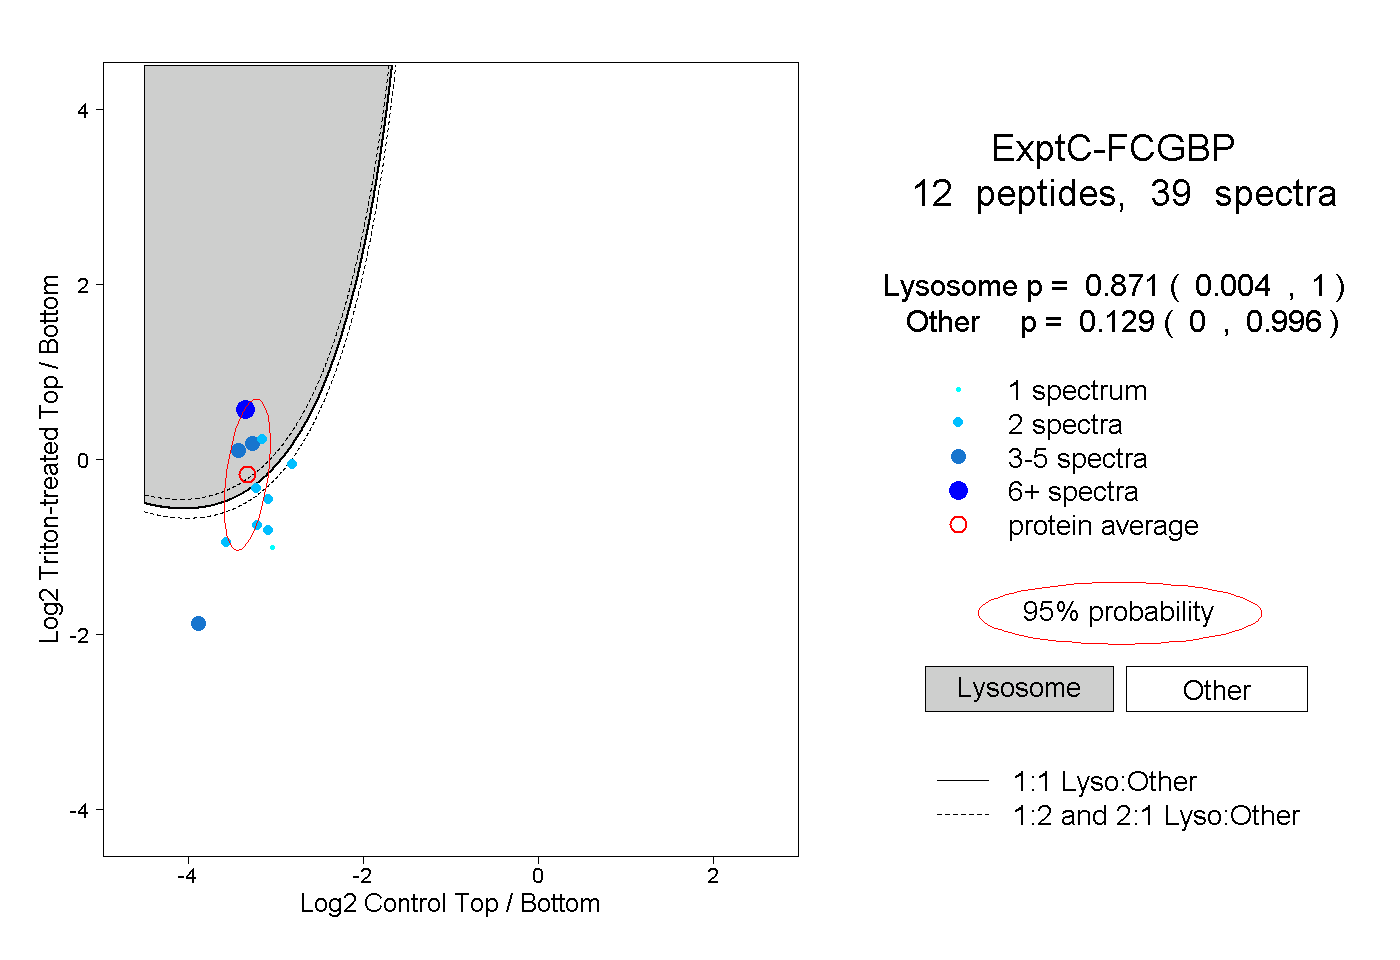
0.004 | 1.000
0.000 | 0.996
2peptides
spectra
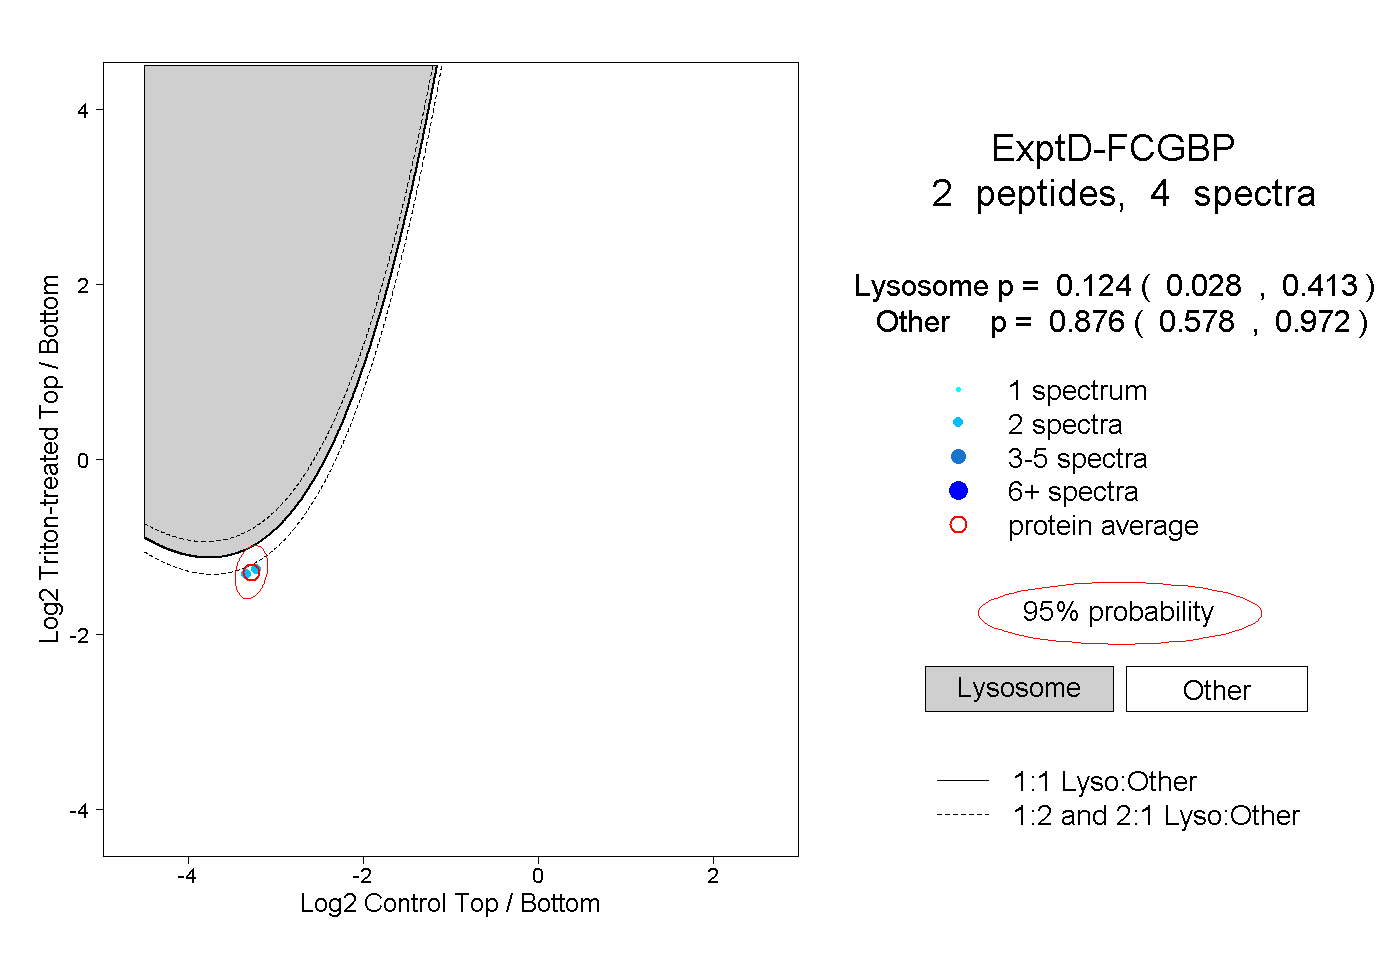
0.028 | 0.413
0.578 | 0.972