 8
8peptides
spectra

0.000 | 0.000
0.920 | 0.944
0.000 | 0.000
0.000 | 0.000
0.000 | 0.000
0.000 | 0.000
0.054 | 0.078
0.000 | 0.000
| Plot | Mito | Lyso | Perox | ER | Golgi | PM | Cytosol | Nucleus | |||||
| Expt A |
8 peptides |
13 spectra |
|
0.000 0.000 | 0.000 |
0.933 0.920 | 0.944 |
0.000 0.000 | 0.000 |
0.000 0.000 | 0.000 |
0.000 0.000 | 0.000 |
0.000 0.000 | 0.000 |
0.067 0.054 | 0.078 |
0.000 0.000 | 0.000 |
| 2 spectra, VVAHGVEVAVR | 0.000 | 0.977 | 0.000 | 0.000 | 0.000 | 0.000 | 0.023 | 0.000 | ||
| 2 spectra, GSQTVSYTR | 0.000 | 1.000 | 0.000 | 0.000 | 0.000 | 0.000 | 0.000 | 0.000 | ||
| 1 spectrum, FCGLLTNPTGPLAACHK | 0.000 | 0.967 | 0.033 | 0.000 | 0.000 | 0.000 | 0.000 | 0.000 | ||
| 1 spectrum, DPCHGITCRPQETCK | 0.000 | 0.801 | 0.000 | 0.000 | 0.000 | 0.000 | 0.199 | 0.000 | ||
| 1 spectrum, GAWVNGLR | 0.000 | 0.977 | 0.000 | 0.000 | 0.000 | 0.000 | 0.023 | 0.000 | ||
| 2 spectra, GNPAVSYVR | 0.000 | 1.000 | 0.000 | 0.000 | 0.000 | 0.000 | 0.000 | 0.000 | ||
| 3 spectra, GSQAVSYTR | 0.000 | 0.931 | 0.000 | 0.000 | 0.000 | 0.000 | 0.069 | 0.000 | ||
| 1 spectrum, DSAGEPQR | 0.000 | 0.553 | 0.000 | 0.000 | 0.000 | 0.176 | 0.271 | 0.000 |
| Plot | Lyso | Other | |||||||||||
| Expt C |
12 peptides |
39 spectra |
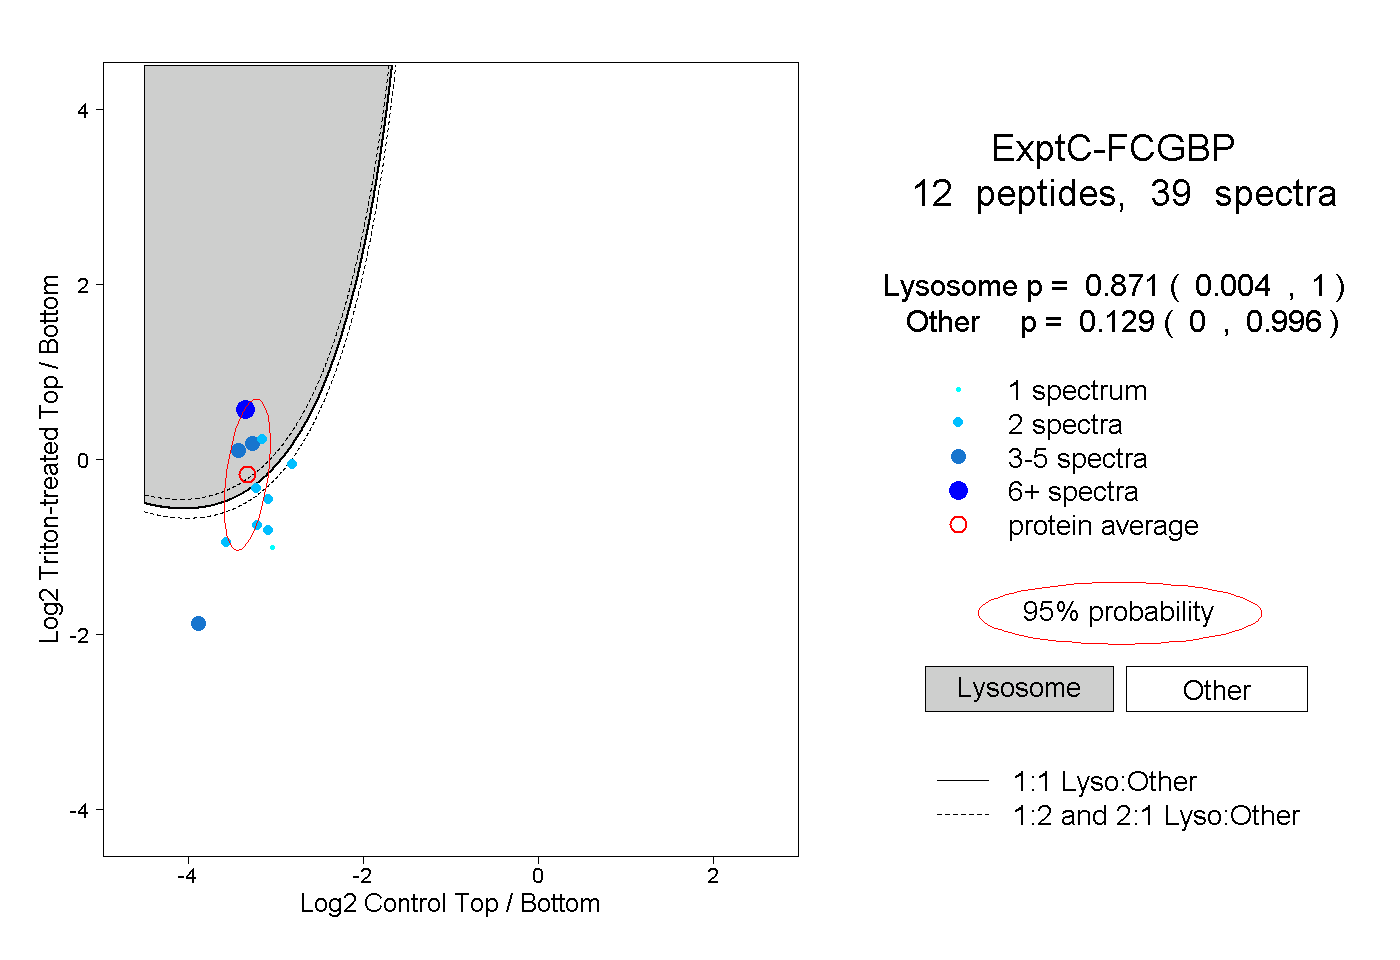 |
0.871 0.004 | 1.000 |
0.129 0.000 | 0.996 |
||||||||
| Plot | Lyso | Other | |||||||||||
| Expt D |
2 peptides |
4 spectra |
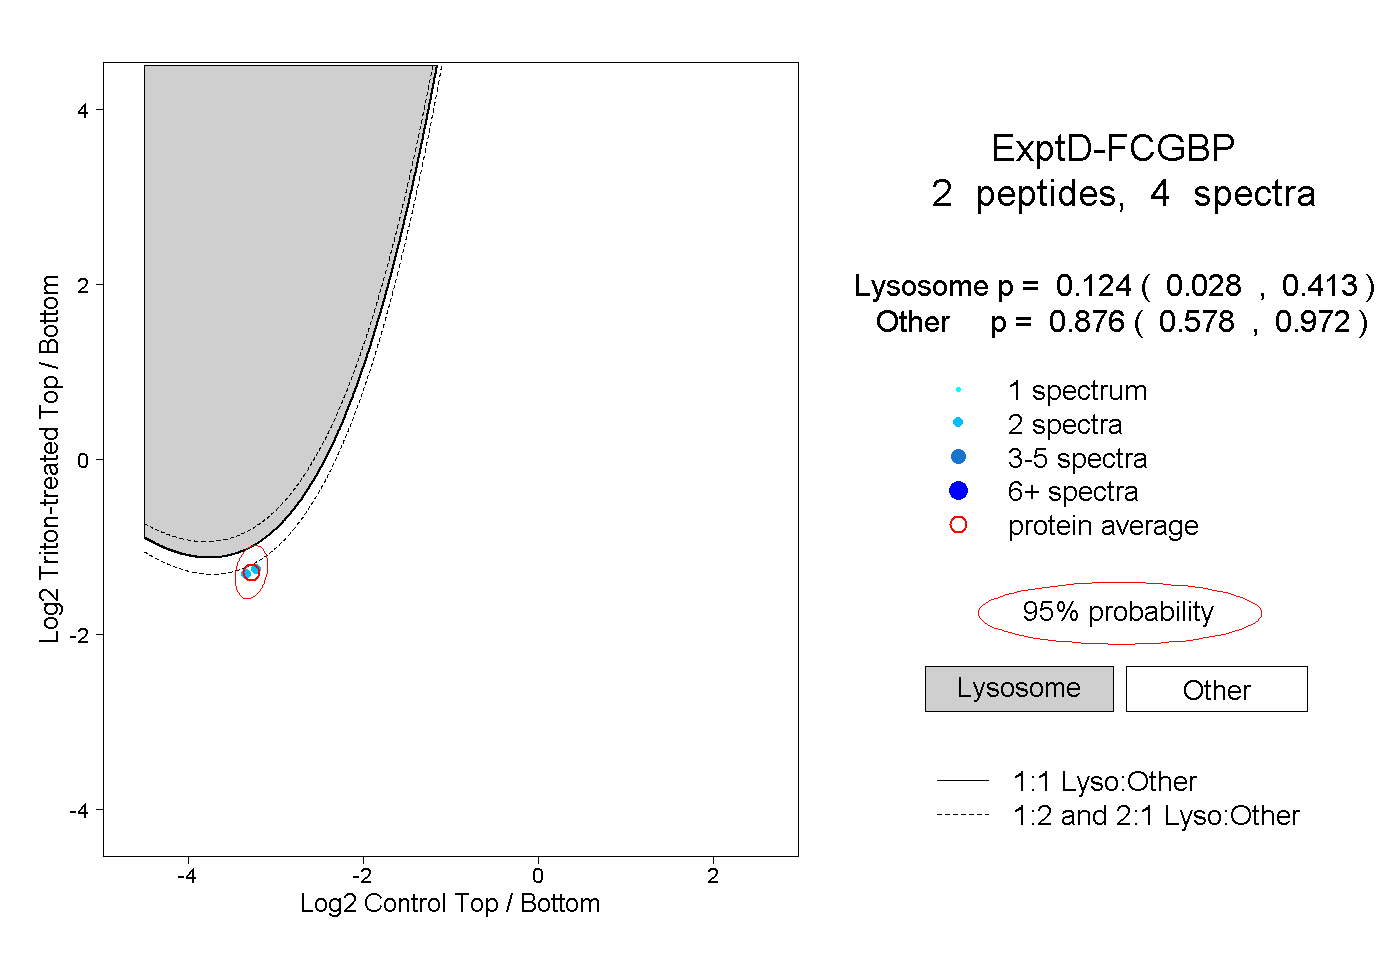 |
0.124 0.028 | 0.413 |
0.876 0.578 | 0.972 |