 5
5peptides
spectra
0.000 | 0.000
0.000 | 0.041
0.000 | 0.004
0.000 | 0.000
0.052 | 0.132
0.680 | 0.769
0.130 | 0.181
0.000 | 0.000
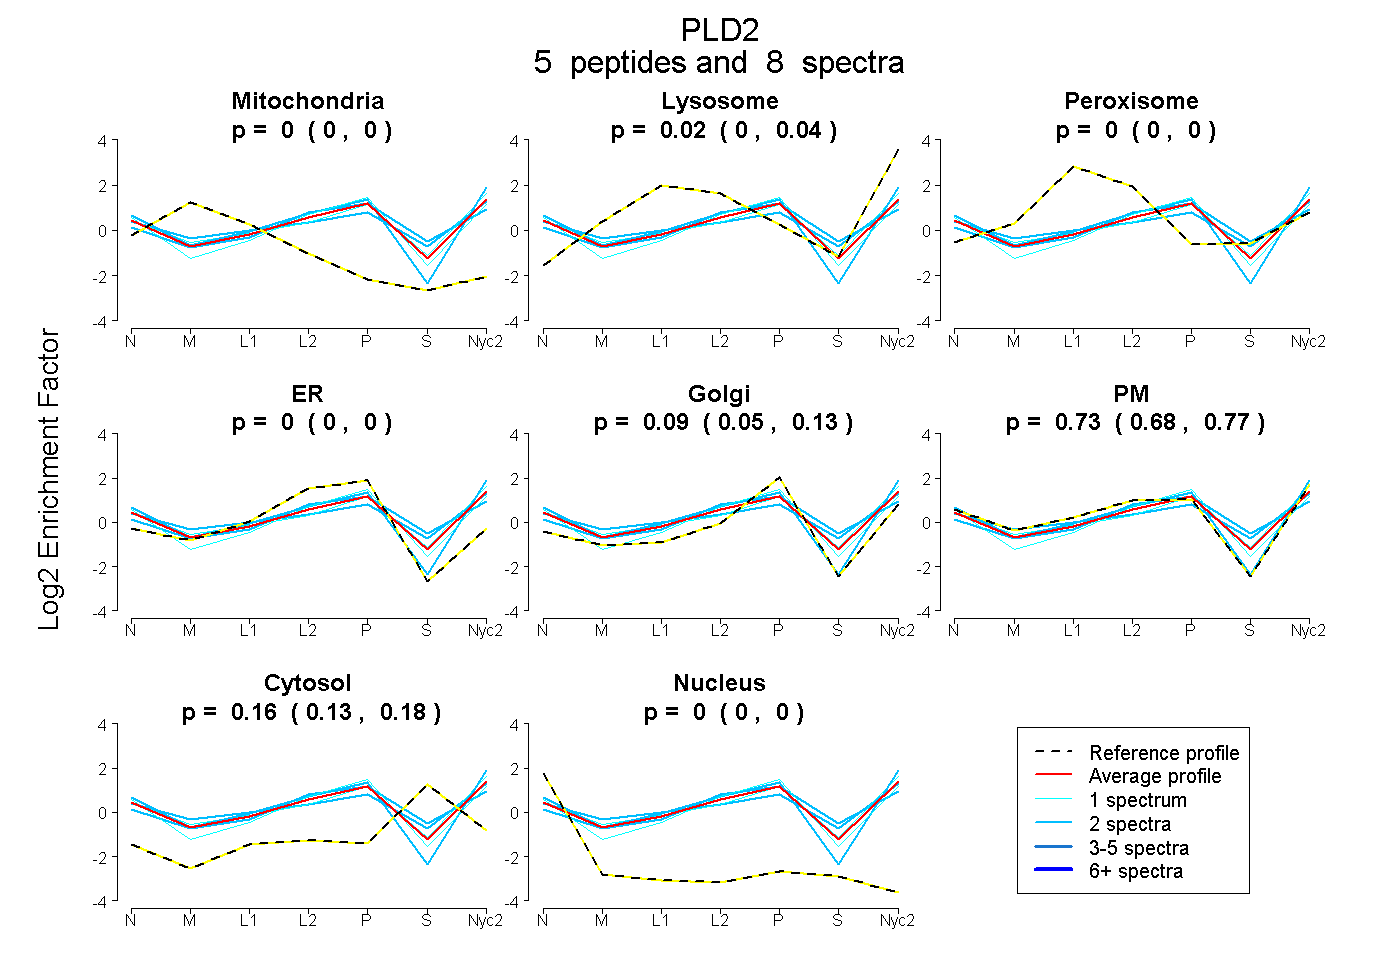
| Plot | Mito | Lyso | Perox | ER | Golgi | PM | Cytosol | Nucleus | |||||
| Expt A |
5 peptides |
8 spectra |
|
0.000 0.000 | 0.000 |
0.017 0.000 | 0.041 |
0.000 0.000 | 0.004 |
0.000 0.000 | 0.000 |
0.090 0.052 | 0.132 |
0.734 0.680 | 0.769 |
0.159 0.130 | 0.181 |
0.000 0.000 | 0.000 |