 5
5peptides
spectra
0.000 | 0.000
0.000 | 0.041
0.000 | 0.004
0.000 | 0.000
0.052 | 0.132
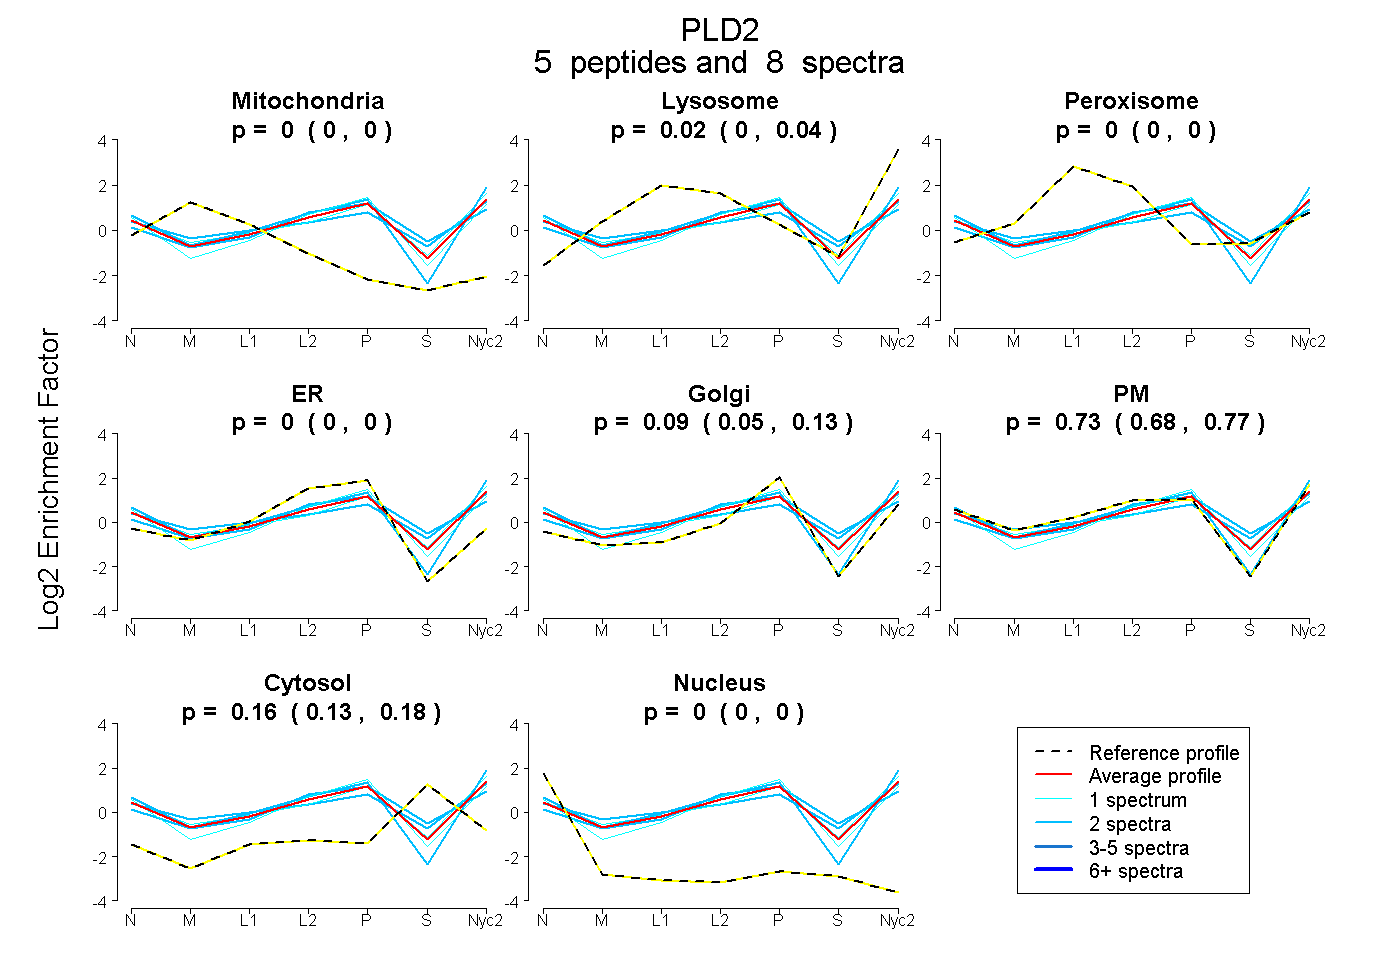
0.680 | 0.769
0.130 | 0.181
0.000 | 0.000
| Plot | Mito | Lyso | Perox | ER | Golgi | PM | Cytosol | Nucleus | |||||
| Expt A |
5 peptides |
8 spectra |
|
0.000 0.000 | 0.000 |
0.017 0.000 | 0.041 |
0.000 0.000 | 0.004 |
0.000 0.000 | 0.000 |
0.090 0.052 | 0.132 |
0.734 0.680 | 0.769 |
0.159 0.130 | 0.181 |
0.000 0.000 | 0.000 |
| 2 spectra, FAAAHSPAR | 0.000 | 0.071 | 0.008 | 0.153 | 0.021 | 0.487 | 0.260 | 0.000 | ||
| 1 spectrum, LLTMSFYR | 0.000 | 0.000 | 0.000 | 0.034 | 0.271 | 0.575 | 0.121 | 0.000 | ||
| 2 spectra, LLIADDR | 0.000 | 0.000 | 0.000 | 0.000 | 0.138 | 0.862 | 0.000 | 0.000 | ||
| 2 spectra, DVGVVVHGVAAR | 0.000 | 0.055 | 0.045 | 0.000 | 0.000 | 0.669 | 0.230 | 0.000 | ||
| 1 spectrum, GHLVHFPLK | 0.000 | 0.065 | 0.000 | 0.000 | 0.088 | 0.686 | 0.161 | 0.000 |