 6
6peptides
spectra

0.667 | 0.698
0.002 | 0.057
0.247 | 0.304
0.000 | 0.000
0.000 | 0.000
0.000 | 0.006
0.000 | 0.009
0.000 | 0.008
2peptides
spectra
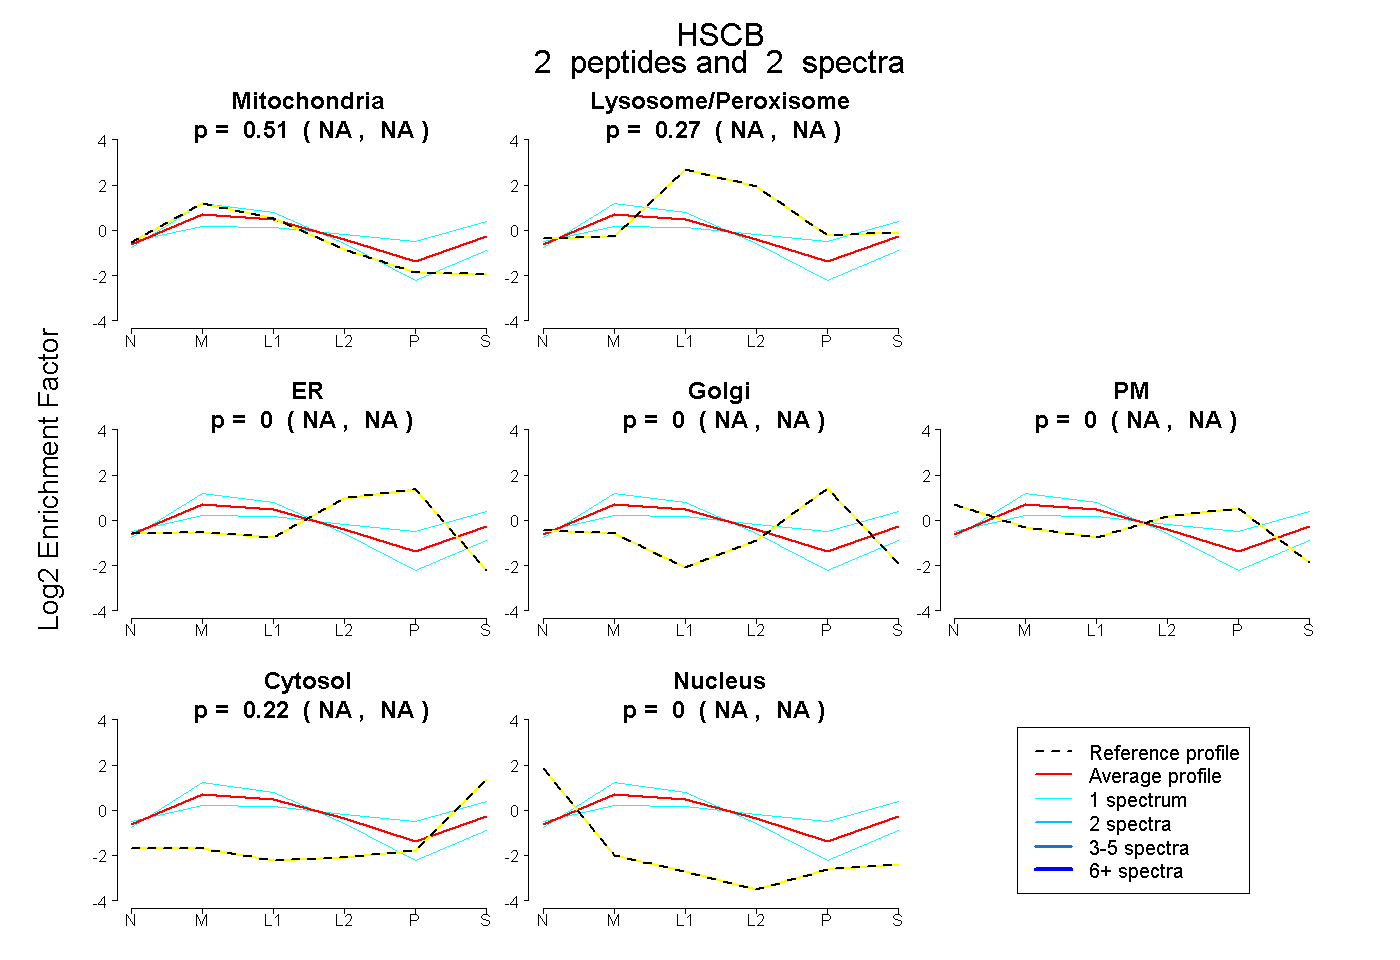
NA | NA
NA | NA
NA | NA
NA | NA
NA | NA
NA | NA
NA | NA
10peptides
spectra
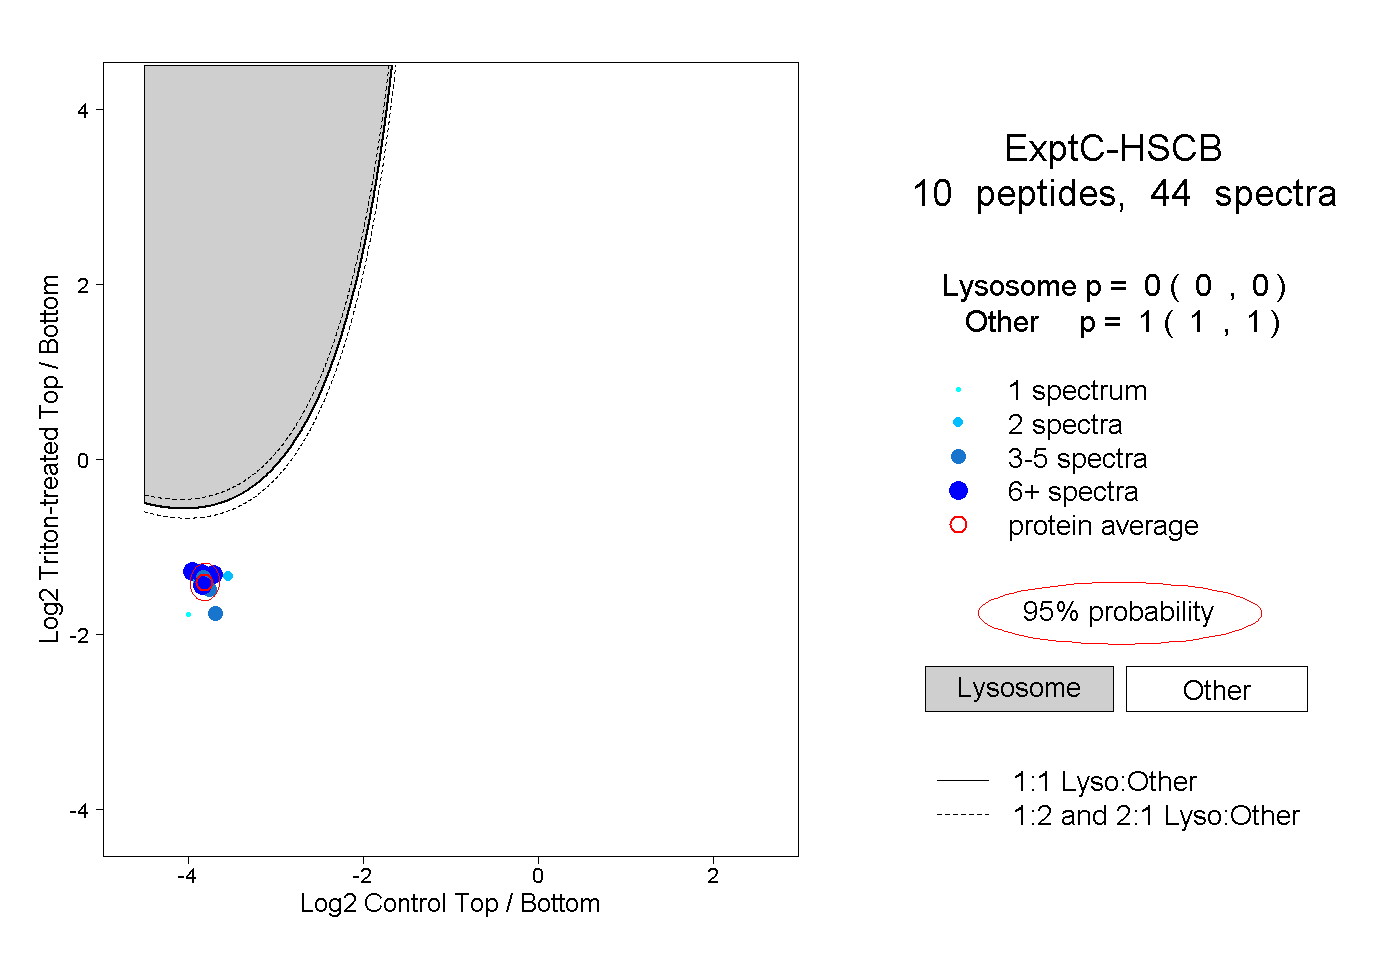
0.000 | 0.000
1.000 | 1.000
2peptides
spectra

NA | NA
NA | NA