 6
6peptides
spectra

0.667 | 0.698
0.002 | 0.057
0.247 | 0.304
0.000 | 0.000
0.000 | 0.000
0.000 | 0.006
0.000 | 0.009
0.000 | 0.008
| Plot | Mito | Lyso | Perox | ER | Golgi | PM | Cytosol | Nucleus | |||||
| Expt A |
6 peptides |
18 spectra |
|
0.685 0.667 | 0.698 |
0.032 0.002 | 0.057 |
0.280 0.247 | 0.304 |
0.000 0.000 | 0.000 |
0.000 0.000 | 0.000 |
0.000 0.000 | 0.006 |
0.000 0.000 | 0.009 |
0.003 0.000 | 0.008 |
| 3 spectra, LVHPDFFSQK | 0.662 | 0.163 | 0.175 | 0.000 | 0.000 | 0.000 | 0.000 | 0.000 | ||
| 3 spectra, AFEQGDFEK | 0.692 | 0.000 | 0.308 | 0.000 | 0.000 | 0.000 | 0.000 | 0.000 | ||
| 1 spectrum, SIEPQCWNCGR | 0.691 | 0.000 | 0.268 | 0.008 | 0.000 | 0.033 | 0.000 | 0.000 | ||
| 8 spectra, EFTDNINR | 0.582 | 0.000 | 0.224 | 0.000 | 0.000 | 0.069 | 0.126 | 0.000 | ||
| 1 spectrum, TDSQFLVEIMEINEK | 0.693 | 0.179 | 0.128 | 0.000 | 0.000 | 0.000 | 0.000 | 0.000 | ||
| 2 spectra, SEAAMEEVEATVR | 0.783 | 0.000 | 0.217 | 0.000 | 0.000 | 0.000 | 0.000 | 0.000 |
| Plot | Mito | Lyso or Perox | ER | Golgi | PM | Cytosol | Nucleus | ||||||
| Expt B |
2 peptides |
2 spectra |
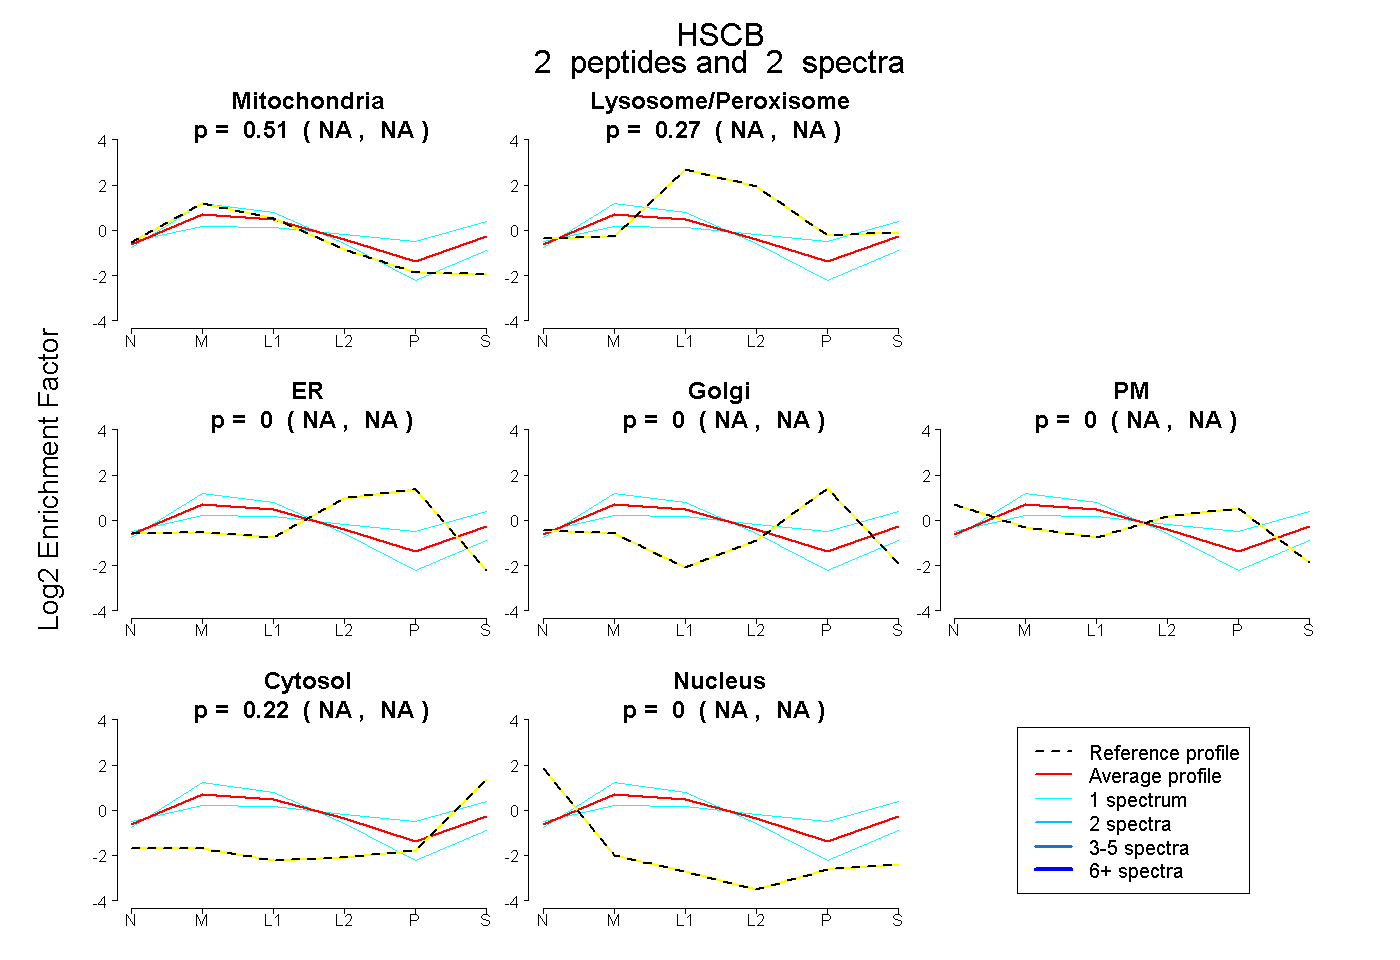 |
0.511 NA | NA |
0.268 NA | NA |
0.000 NA | NA |
0.000 NA | NA |
0.000 NA | NA |
0.221 NA | NA |
0.000 NA | NA |
|||
| Plot | Lyso | Other | |||||||||||
| Expt C |
10 peptides |
44 spectra |
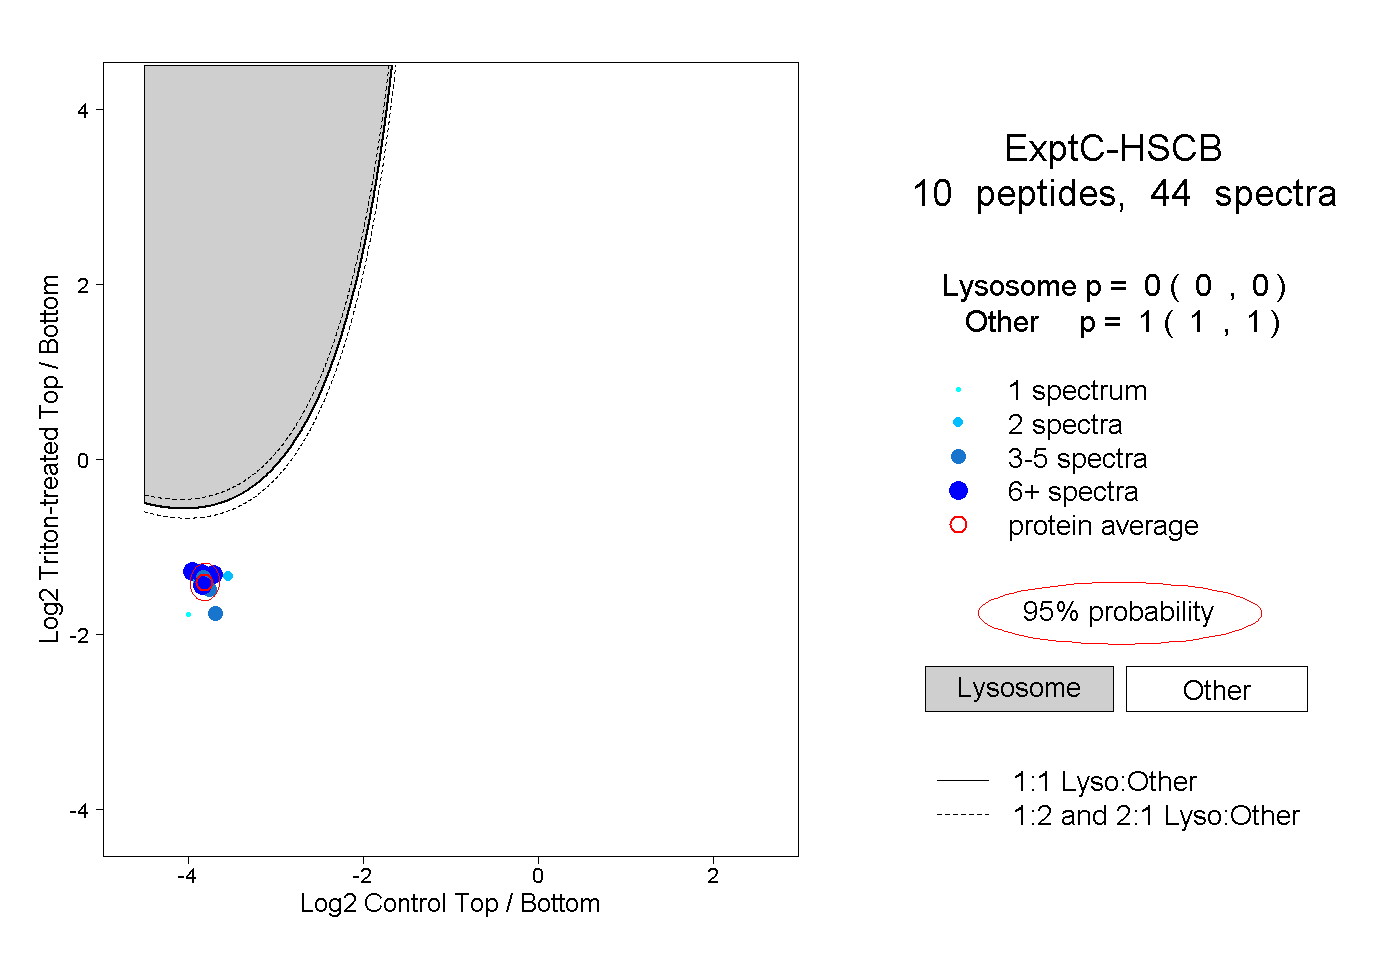 |
0.000 0.000 | 0.000 |
1.000 1.000 | 1.000 |
||||||||
| Plot | Lyso | Other | |||||||||||
| Expt D |
2 peptides |
2 spectra |
 |
0.004 NA | NA |
0.996 NA | NA |