 5
5peptides
spectra
0.000 | 0.042
0.010 | 0.137
0.039 | 0.159
0.000 | 0.000
0.000 | 0.000
0.066 | 0.151
0.666 | 0.710
0.000 | 0.000
3peptides
spectra
0.000 | 0.000
1.000 | 1.000
| Plot | Mito | Lyso | Perox | ER | Golgi | PM | Cytosol | Nucleus | |||||
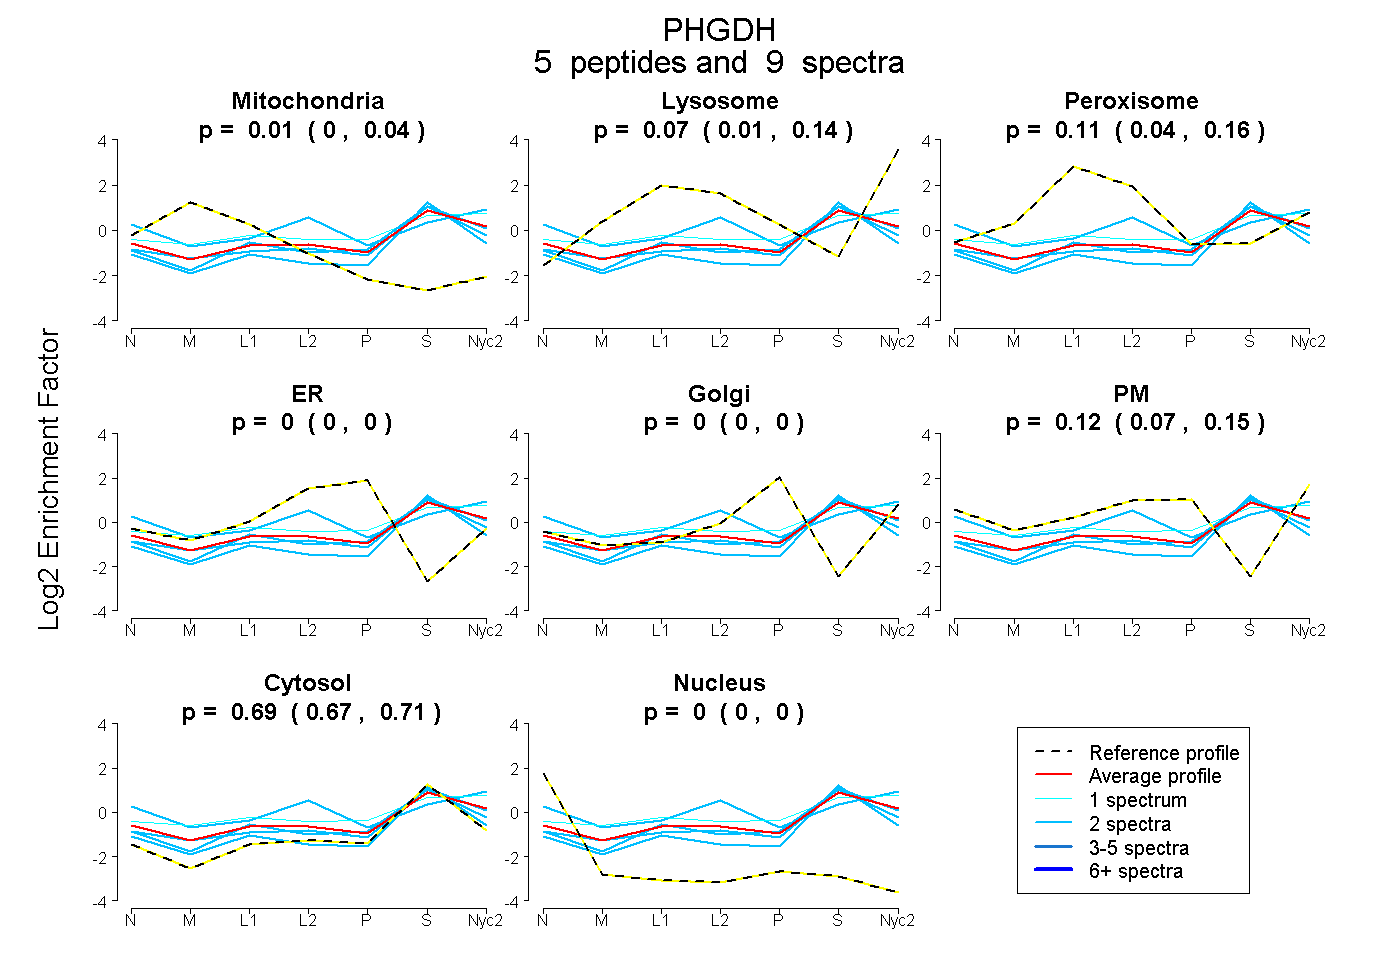
| Expt A |
5 peptides |
9 spectra |
|
0.007 0.000 | 0.042 |
0.071 0.010 | 0.137 |
0.112 0.039 | 0.159 |
0.000 0.000 | 0.000 |
0.000 0.000 | 0.000 |
0.117 0.066 | 0.151 |
0.693 0.666 | 0.710 |
0.000 0.000 | 0.000 |
||
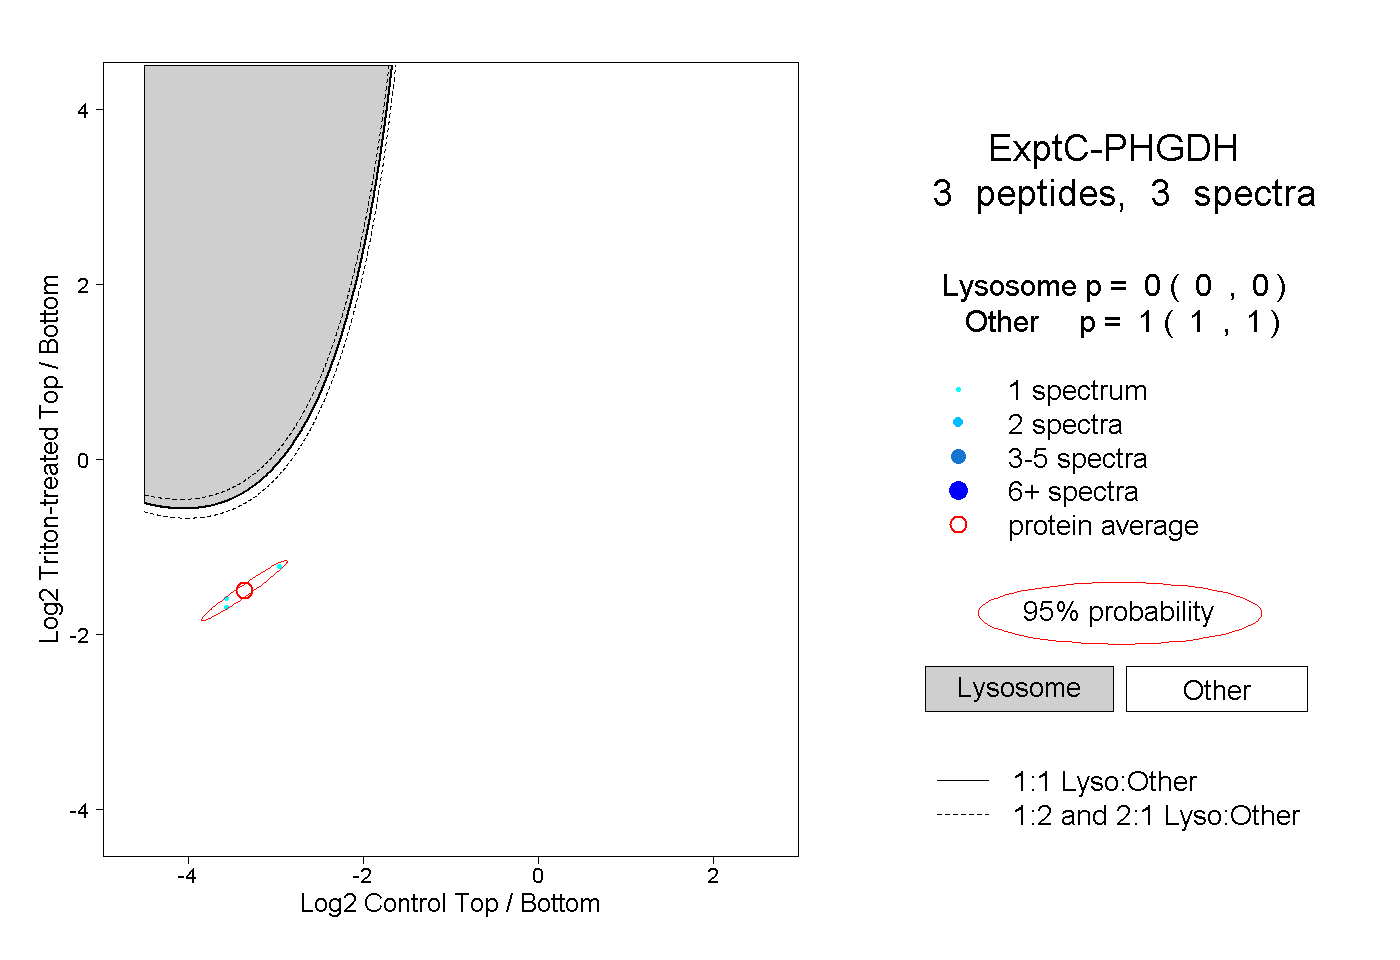
| Plot | Lyso | Other | |||||||||||
| Expt C |
3 peptides |
3 spectra |
|
0.000 0.000 | 0.000 |
1.000 1.000 | 1.000 |