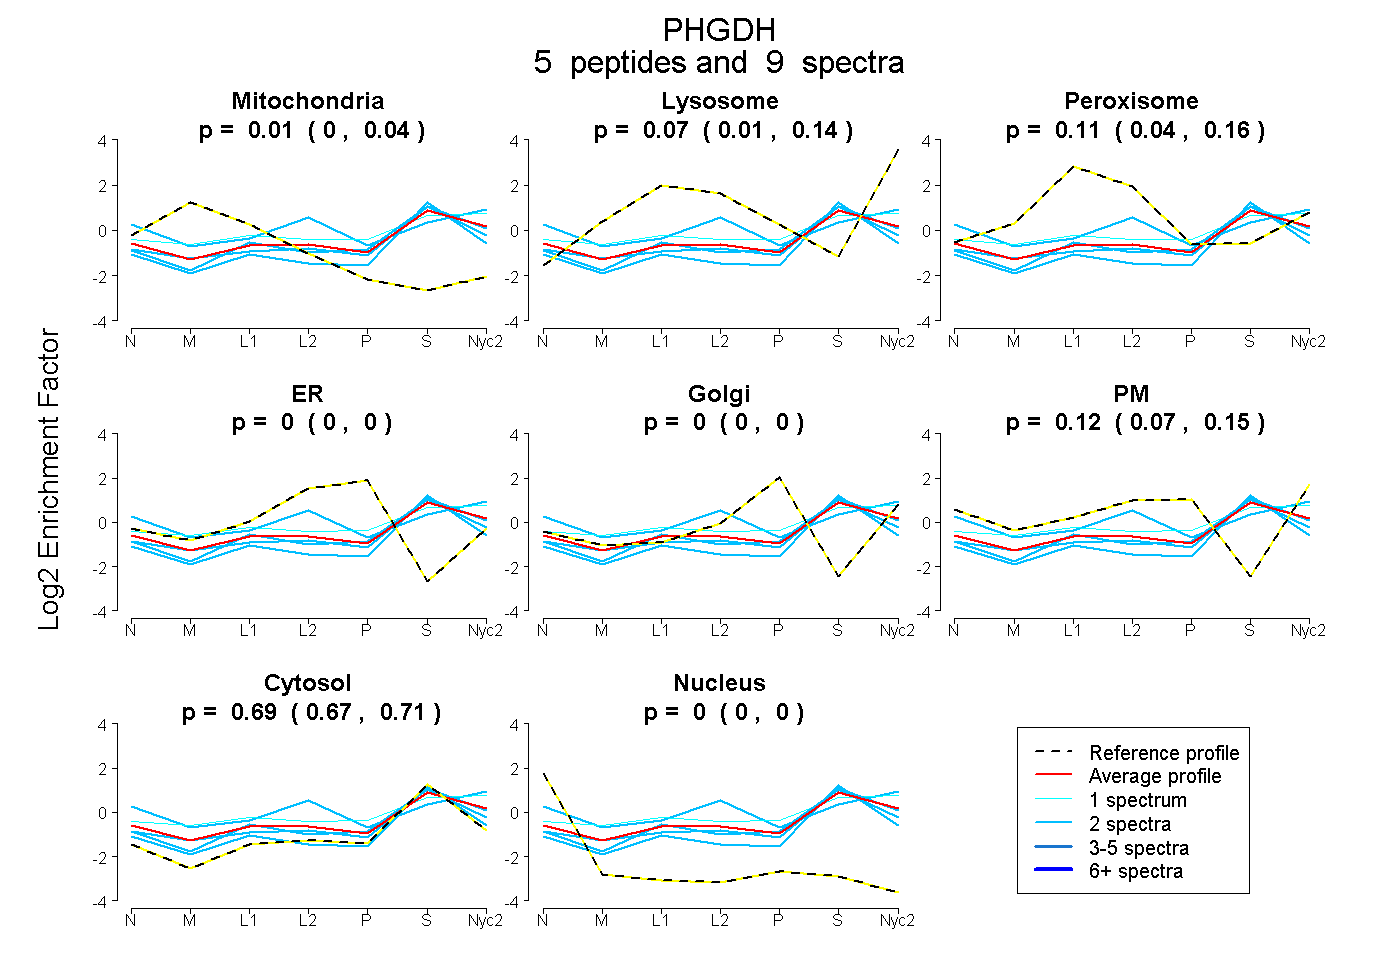
 5
5peptides
spectra
0.000 | 0.042
0.010 | 0.137
0.039 | 0.159
0.000 | 0.000
0.000 | 0.000
0.066 | 0.151
0.666 | 0.710
0.000 | 0.000
| Plot | Mito | Lyso | Perox | ER | Golgi | PM | Cytosol | Nucleus | |||||
| Expt A |
5 peptides |
9 spectra |
|
0.007 0.000 | 0.042 |
0.071 0.010 | 0.137 |
0.112 0.039 | 0.159 |
0.000 0.000 | 0.000 |
0.000 0.000 | 0.000 |
0.117 0.066 | 0.151 |
0.693 0.666 | 0.710 |
0.000 0.000 | 0.000 |
| 2 spectra, GGIVDEGALLR | 0.071 | 0.022 | 0.019 | 0.000 | 0.000 | 0.000 | 0.888 | 0.000 | ||
| 2 spectra, GQPLLLFR | 0.000 | 0.021 | 0.135 | 0.000 | 0.000 | 0.067 | 0.778 | 0.000 | ||
| 2 spectra, AGTGVDNVDLEAATR | 0.000 | 0.035 | 0.213 | 0.000 | 0.000 | 0.326 | 0.427 | 0.000 | ||
| 2 spectra, TLGILGLGR | 0.049 | 0.163 | 0.014 | 0.000 | 0.000 | 0.023 | 0.751 | 0.000 | ||
| 1 spectrum, CGEEIAVQFVDMVK | 0.003 | 0.179 | 0.097 | 0.000 | 0.000 | 0.184 | 0.538 | 0.000 |
| Plot | Lyso | Other | |||||||||||
| Expt C |
3 peptides |
3 spectra |
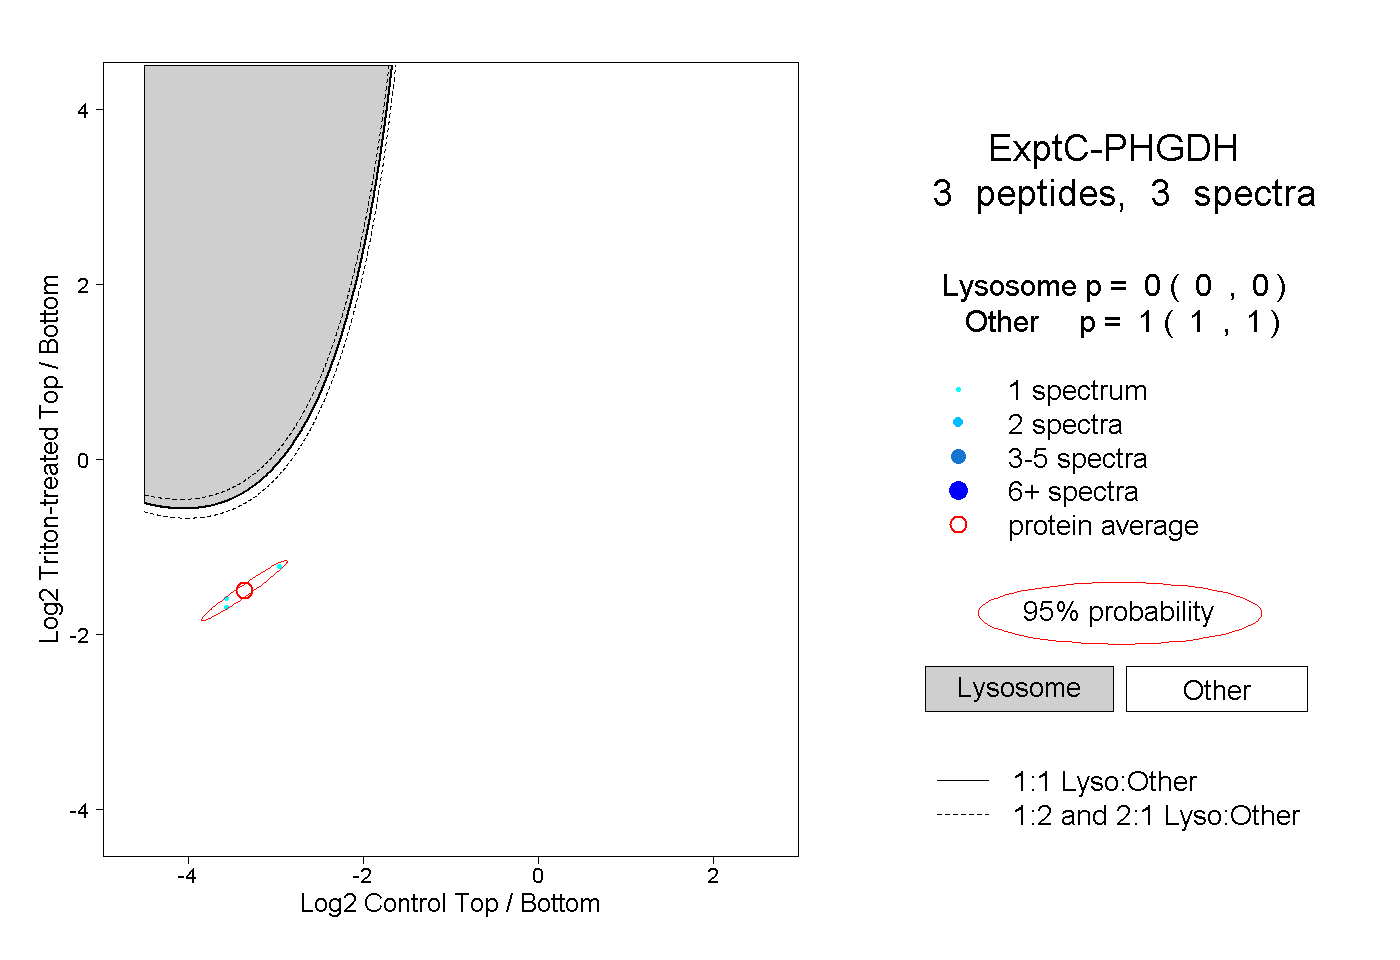 |
0.000 0.000 | 0.000 |
1.000 1.000 | 1.000 |